
Archivo:Atmospheric CO2 with glaciers cycles.png

Ver la imagen en su resolución original (939 × 680 píxeles; tamaño de archivo: 41 kB; tipo MIME: image/png)

|
Esta imagen debería volverse a crear como imágenes vectoriales SVG. Esto proporciona muchas ventajas, véase Commons:Media for cleanup (en inglés) para más información. Si ya hay una versión SVG de esta imagen disponible, por favor súbala a Commons. Tras subirla, reemplace esta plantilla con la plantilla
{{vector version available|nuevo nombre de imagen.svg}} en esta imagen. |
Resumen
| Descripción |
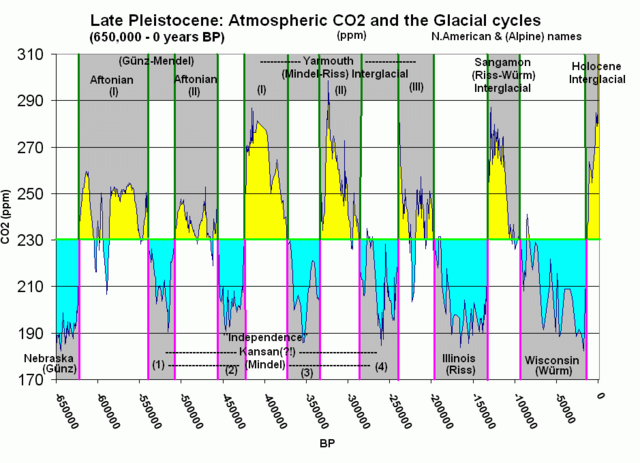
Ice Core data for Atmospheric CO2 related to the glacial cycles |
| Fecha | |
| Fuente |
Source data: (Combined)
|
| Autor | Tom Ruen en:User:Tomruen |
| Permiso (Reutilización de este archivo) |
PD-self |
Licencia
| Yo, el titular de los derechos de autor de esta obra, lo libero al dominio público. Esto aplica en todo el mundo. En algunos países esto puede no ser legalmente factible; si ello ocurriese: Concedo a cualquier persona el derecho de usar este trabajo para cualquier propósito, sin ningún tipo de condición al menos que éstas sean requeridas por la ley. |
Upload foo
This image was copied from en:Image:Atmospheric_CO2_with_glaciers_cycles.gif. Below is the original description.
Original edit-history of the image
- 15:25, 3 December 2005 en:User:Tomruen m
- 15:13, 3 December 2005 en:User:Tomruen (link source of data)
- 14:38, 3 December 2005 en:User:Tomruen
Registro original de carga
| Fecha y hora | Dimensiones | Usuario | Comentario |
|---|---|---|---|
| 6 de mayo de 2006, 14:20:43 | 939 × 680 (49916 bytes) | Neumeier (discusión · contribs.) | {{Information| |Description=Ice Core data for Atmospheric CO2 related to the glacial cycles |Source=copied from [[:en:Image:Atmospheric_CO2_with_glaciers_cycles.gif]] |Date=3 December 2005 |Author=en:User:Tomruen |Permission=PD-self |other_versions= }} ' |
Historial del archivo
Haz clic sobre una fecha y hora para ver el archivo tal como apareció en ese momento.
| Fecha y hora | Miniatura | Dimensiones | Usuario | Comentario | |
|---|---|---|---|---|---|
| actual | 15:58 18 ago 2014 | | 939 × 680 (41 kB) | GifTagger | Bot: Converting file to superior PNG file. (Source: Atmospheric_CO2_with_glaciers_cycles.gif). This GIF was problematic due to non-greyscale color table. |
Usos del archivo
Las siguientes páginas usan este archivo:
Uso global del archivo
Las wikis siguientes utilizan este archivo:
- Uso en als.wikipedia.org
- Uso en de.wikipedia.org
- Uso en de.wiktionary.org
- Uso en en.wikipedia.org
- Uso en en.wikibooks.org
- Uso en fr.wikipedia.org
- Uso en hu.wikipedia.org
- Uso en it.wikipedia.org
- Uso en ka.wikipedia.org
- Uso en nl.wikipedia.org
- Uso en no.wikipedia.org
- Uso en vi.wikipedia.org
- Uso en zh.wikipedia.org