
Archivo:USGS magnitude 8 earthquakes since 1900.svg

Tamaño de esta previsualización PNG del archivo SVG: 512 × 512 píxeles. Otras resoluciones: 240 × 240 píxeles · 480 × 480 píxeles · 768 × 768 píxeles · 1024 × 1024 píxeles · 2048 × 2048 píxeles.
Ver la imagen en su resolución original ((Imagen SVG, nominalmente 512 × 512 pixels, tamaño de archivo: 112 kB))
Resumen
| Descripción |
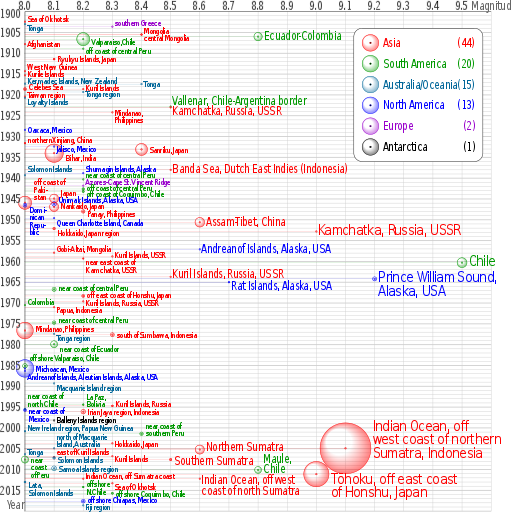
English: Earthquakes of moment magnitude 8.0 and greater from 1900 to 2018. The apparent 3D volumes of the bubbles are linearly proportional to their respective fatalities, i.e. their radii are linearly proportional to the cube root of the fatalities. Data is from https://earthquake.usgs.gov/earthquakes/eqarchives/year/mag8/magnitude8_1900_date.php ; The colour indicates the continent, and the legend counts the number of quakes for each. Notice the absence of Africa and the low presence of Antarctica and Europe. |
| Fuente | Trabajo propio |
| Autor | Cmglee |
| SVG desarrollo | El código fuente de esta imagen SVG es válido. Este gráfico vectorial fue creado con perl This file uses embedded text that can be easily translated using a text editor. |
| Código fuente | PERL codetest
Perl script to create above; please do not remove.
#!/usr/bin/perl
$data_string = qq`
as|1902/06/11 05:|50.00|148.00|8.0||Sea of Okhotsk|-8
oc|1903/01/04 05:07|-20.00|-175.00|8.0||Tonga|8
eu|1903/08/11 04:32|36.36|22.97|8.3||southern Greece|-10
as|1905/07/09 09:40|49.0|99.0|8.4||Mongolia|-10
as|1905/07/23 02:46|49.0|98.0|8.4||central Mongolia|8
sa|1906/01/31 15:36|1.0|-81.5|8.8|1000|Colombia-Ecuador||Ecuador-Colombia
sa|1906/08/17 00:40|-33.0|-72.0|8.2|3882|Valparaiso, Chile|5|Valparaiso,Chile
as|1907/10/21 04:23|38.00|69.00|8.0||Afghanistan
sa|1908/12/12 12:08|-14.0|-78.0|8.2||off the coast of central Peru|5|off coast of central Peru
as|1911/06/15 14:26|28.0|130.0|8.1|12|Ryukyu Islands, Japan
as|1914/05/26 14:22|-2.|137.|8.0||West New Guinea|-10
as|1915/05/01 05:00|47.|155.|8.0||Kurile Islands|-4
oc|1917/05/01 18:26|-29.0|-177.0|8.0||Kermadec Islands, New Zealand|-8
oc|1917/06/26 05:49|-15.0|-173.0|8.4||Tonga
as|1918/08/15 12:18|5.653|123.563|8.0|50|Celebes Sea|-5
as|1918/09/07 17:16|45.5|151.5|8.2||Kuril Islands|-4
oc|1919/04/30 07:17|-19.823|-172.215|8.2||Tonga region|5
as|1920/06/05 04:21|23.5|122.0|8.0||Taiwan region|-5
oc|1920/09/20 14:39|-20.0|168.0|8.0||Loyalty Islands|10
sa|1922/11/11 04:32|-28.553|-70.755|8.5||Chile-Argentina Border|-12|Vallenar, Chile-Argentina border
as|1923/02/03 16:01|54.0|161.0|8.5||Kamchatka|10|Kamchatka, Russia, USSR
as|1924/04/14 16:20|7.023|125.954|8.3||Mindanao, Philippines||Mindanao,~Philippines
na|1928/06/17 03:19|16.33|-96.7|8.0||Oaxaca, Mexico
as|1931/08/10 21:18|47.1|89.8|8.0|5|northern Xinjiang, China|-8
na|1932/06/03 10:36|19.84|-103.99|8.1||Jalisco, Mexico|5
as|1933/03/02 17:31|39.22|144.62|8.4|2990|Sanriku, Japan
as|1934/01/15 08:43|27.55|87.09|8.1|10700|Bihar, India|10
as|1938/02/01 19:04|-5.05|131.62|8.5||Banda Sea||Banda Sea, Dutch East Indies (Indonesia)
na|1938/11/10 20:18|55.33|-158.37|8.2||Shumagin Islands, Alaska|-12
oc|1939/04/30 02:55|-10.5|158.5|8.0||Solomon Islands|-15
sa|1940/05/24 16:33|-10.5|-77.0|8.2||near the Coast of central Peru|-12|near coast of central Peru
eu|1941/11/25 18:03|37.171|-18.960|8.2||Azores-Cape St. Vincent Ridge|-10
sa|1942/08/24 22:50|-15.0|-76.0|8.2|30|Off the coast of central Peru|-3|off coast of central Peru
sa|1943/04/06 16:07|-30.75|-72.0|8.2|18|off the coast of Coquimbo, Chile|5|off coast of Coquimbo, Chile
as|1944/12/07 04:35|33.75|136.00|8.1|1223|Tonankai, Japan|-15|Japan
as|1945/11/27 21:57|24.5|63.0|8.0|4000|off the coast of Pakistan|-50|off coast of~Paki-~stan
na|1946/04/01 12:28|52.75|-163.50|8.1|165|Unimak Islands, Alaska|-10|Unimak Islands, Alaska, USA
na|1946/08/04 17:51|19.25|-69.00|8.0|100|Dominican Republic|10|Domi-~nican~Repu-~blic
as|1946/12/20 19:19|32.5|134.5|8.1|1330|Nankaido, Japan|-2
as|1948/01/24 17:46|10.5|122.0|8.2|72|Panay, Philippines|5
na|1949/08/22 04:01|53.62|-133.27|8.1||Queen Charlotte Island, B.C., Canada|10|Queen Charlotte Island, Canada
as|1950/08/15 14:09|28.5|96.5|8.6|1526|Assam-Tibet||Assam-Tibet, China
as|1952/03/04 01:22|42.5|143.0|8.1|31|Hokkaido, Japan region|10
as|1952/11/04 16:58|52.76|160.06|9.0||Kamchatka, Russia||Kamchatka, Russia, USSR
na|1957/03/09 14:22|51.56|-175.39|8.6||Andreanof Islands, Alaska||Andreanof Islands, Alaska, USA
as|1957/12/04 03:37|45.15|99.21|8.1||Gobi-Altai, Mongolia|-10
as|1958/11/06 22:58|44.329|148.623|8.3||Kuril Islands|-3|Kuril Islands, USSR
as|1959/05/04 07:15|53.351|159.645|8.2|1|near the east coast of Kamchatka|8|near east coast of~Kamchatka, USSR
sa|1960/05/22 19:11|-38.29|-73.05|9.5|1655|Chile
as|1963/10/13 05:17|44.9|149.6|8.5||Kuril Islands|-5|Kuril Islands, Russia, USSR
na|1964/03/28 03:36|61.02|-147.65|9.2|125|Prince William Sound, Alaska||Prince William Sound,~Alaska, USA
na|1965/02/04 05:01|51.21|-178.50|8.7|5|Rat Islands, Alaska|10|Rat Islands, Alaska, USA
sa|1966/10/17 21:41|-10.807|-78.684|8.1|125|near the coast of central Peru|-5|near coast of central Peru
as|1968/05/16 00:49|40.903|143.346|8.2|47|off the east coast of Honshu, Japan|-4|off east coast of Honshu, Japan
as|1969/08/11 21:27|43.478|147.815|8.2||Kuril Islands|2|Kuril Islands, Russia, USSR
sa|1970/07/31 17:08|-1.49|-72.56|8.0||Colombia|-8
as|1971/01/10 07:17|-3.132|139.697|8.1||Papua, Indonesia|5
sa|1974/10/03 14:21|-12.254|-77.524|8.1|78|near the coast of central Peru|-7|near coast of central Peru
as|1976/08/16 16:11|6.292|124.090|8.0|8000|Mindanao, Philippines|-5
oc|1977/06/22 12:08|-22.878|-175.900|8.1||Tonga region|8
as|1977/08/19 06:08|-11.085|118.464|8.3|100|south of Sumbawa, Indonesia
sa|1979/12/12 07:59|1.598|-79.358|8.1|600|near the coast of Ecuador|10|near coast of Ecuador
sa|1985/03/03 22:47|-33.135|-71.871|8.0|177|offshore Valparaiso, Chile|-20
na|1985/09/19 13:17|18.190|-102.533|8.0|9500|Michoacan, Mexico
na|1986/05/07 22:47|51.520|-174.776|8.0||Andreanof Islands, Aleutian Islands, Alaska|15|Andreanof Islands, Aleutian Islands, Alaska, USA
oc|1989/05/23 10:54|-52.341|160.568|8.1||Macquarie Island region|10
sa|1994/06/09 00:33|-13.841|-67.553|8.2|5|La Paz, Bolivia|-20|La Paz,~Bolivia
as|1994/10/04 13:22|43.773|147.321|8.3|11|Kuril Islands|-5|Kuril Islands, Russia
sa|1995/07/30 05:11|-23.340|-70.294|8.0|3|Near Coast of Northern Chile|-32|near coast of~north Chile
na|1995/10/09 15:35|19.055|-104.205|8.0|49|Near Coast of Jalisco, Mexico|2|near coast of~Mexico
as|1996/02/17 05:59|-0.891|136.952|8.2|166|Irian Jaya region, Indonesia
an|1998/03/25 03:12|-62.877|149.527|8.1||Balleny Islands region|-2
oc|2000/11/16 04:54|-3.980|152.169|8.0|2|New Ireland region, Papua New Guinea|-8
sa|2001/06/23 20:33|-16.264|-73.641|8.4|75|near the coast of southern Peru|-20|near coast of~southern Peru
as|2003/09/25 19:50|41.815|143.910|8.3||Hokkaido, Japan region||Hokkaido, Japan
oc|2004/12/23 14:59|-49.312|161.345|8.1||north of Macquarie Island|-28|north of Macquarie~Island, Australia
as|2004/12/26 00:58|3.295|95.982|9.1|227898|off the west coast of northern Sumatra|-50|Indian Ocean, off~west coast of northern~Sumatra, Indonesia
as|2005/03/28 16:09|2.074|97.013|8.6|1313|Northern Sumatra, Indonesia|-5|Northern Sumatra
oc|2006/05/03 15:26|-20.187|-174.123|8.0||Tonga|-5
as|2006/11/15 11:14|46.592|153.226|8.3||Kuril Islands|5
as|2007/01/13 04:23:21|46.243|154.524|8.1||East of the Kuril Islands|-13|east of Kuril Islands
oc|2007/04/01 20:39:58|-8.466|157.043|8.1|34|Solomon Islands|5
sa|2007/08/15 23:40:57|-13.386|-76.603|8.0|650|Near the Coast of Central Peru||near~coast~of Peru
as|2007/09/12 11:10:26|-4.438|101.367|8.5|25|Southern Sumatra, Indonesia|5|Southern Sumatra
oc|2009/09/29 17:48:10|-15.489|-172.095|8.1|192|Samoa Islands region|0
sa|2010/02/27 06:34:14|-35.846|-72.719|8.8|577|Offshore Maule, Chile|-25|Maule,~Chile
as|2011/03/11 05:46:23|38.322|142.369|9.0|28050|Near the East Coast of Honshu, Japan|15|Tōhoku, off east coast~of Honshu, Japan
as|2012/04/11 08:38:37|2.311|93.063|8.6||off the west coast of northern Sumatra|5|Indian Ocean, off west~coast of north Sumatra
as|2012/04/11 10:43:09|0.773|92.452|8.2||off the west coast of northern Sumatra|-7|Indian Ocean, off Sumatra coast
oc|2013/02/06 01:12:27|-10.738|165.138|8.0|13|Lata,~Solomon Islands|7|
as|2013/05/24 06:44:49|54.874|153.281|8.3||Sea of Okhotsk|7|
sa|2014/04/01 23:46:47|-19.642|-70.817|8.2|6|offshore~N.Chile|-7|
sa|2015/09/16 22:54|-31.570|-71.654|8.3|14|offshore Coquimbo, Chile
na|2017/09/08 04:49|15.022|-93.899|8.2|98|offshore Chiapas, Mexico|-3
oc|2018/08/19 00:19|-18.178|-178.111|8.2|0|Fiji region|4
`;
%continents = (
"na" => { "colour" => "#0000ff", "count" => 0, "name" => "North America" },
"sa" => { "colour" => "#009900", "count" => 0, "name" => "South America" },
"eu" => { "colour" => "#9900cc", "count" => 0, "name" => "Europe" },
"af" => { "colour" => "#996600", "count" => 0, "name" => "Africa" },
"as" => { "colour" => "#ff0000", "count" => 0, "name" => "Asia" },
"oc" => { "colour" => "#006699", "count" => 0, "name" => "Australia/Oceania" },
"an" => { "colour" => "#000000", "count" => 0, "name" => "Antarctica" },
undef);
@continent_order = ("as", "sa", "oc", "na", "eu", "an", "af");
# @continent_order = ("na","sa", "eu", "af", "as", "oc", "an");
$mag_min = 8; $mag_max = 9.6; $date_min = 1900; $date_max = 2020;
$x_min = 0; $x_max = &x($mag_max); $y_min = 0; $y_max = &y($date_max);
$x_legend = 790; $y_legend = 40; $w_legend = 310; $h_legend = 320;
$x_viewbox = -60; $y_viewbox = -28; $width_viewbox = 1230; $height_viewbox = 1230;
$out_graph = $out_legend = $out_grid = $out_grad = "";
$x_margin = &x($mag_min);
sub year_fraction {
($y, $m, $d) = split(/\//, $_[0]);
# $y = $_[0];
# $m = $_[1] || 1;
# $d = $_[2] || 1;
$is_leap_year = $y % 100 ? ($y % 4 == 0) : ($y % 400 == 0);
$day_of_year = int($d - ($m < 3 ? 30 : $is_leap_year ? 31 : 32) + 30.56 * $m);
return $y + ($day_of_year - 1) / ($is_leap_year ? 366 : 365);
}
sub x { return sprintf("%.3f", 700 * ($_[0] - $mag_min)); }
sub y { return sprintf("%d", 10 * ($_[0] - $date_min)); }
$double_dash = "-" . "-";
$file_out = $0; $file_out =~ s/[^\.]*$/svg/;
@data = split(/\n/, $data_string);
foreach (@data) {
if ($_ && substr($_, 0, 1) ne "#") {
($continent, $datetime, $latitude, $longitude, $magnitude, $fatalities, $region, $label_offset, $label) = split(/\|/, $_);
if ($magnitude >= $mag_min) {
print "$continent\t$datetime\t$latitude\t$longitude\t$magnitude\t$fatalities\t$region\t$label_offset\t$label\n";
($date, $time) = split(/\s/, $datetime);
$x = &x($magnitude);
$y = &y(&year_fraction($date));
$r = $fatalities ** (1 / 3);
$x_label = $x + $r + 4;
$y_label = $y + $label_offset + 8;
$colour = $continents{$continent}{"colour"};
++$continents{$continent}{"count"};
if ($label eq "") { $label = $region; }
if ($label =~ m/~/) {
$label =~ s`~`</tspan><tspan x="0" dy="0.9em">`g;
$label = qq`<tspan>${label}</tspan>`;
}
$font_size = $magnitude < 8.5 ? qq` font-size="20"` :
($magnitude >= 9 ? qq` font-size="36"` : qq``);
$out_graph .= qq`
<g stroke="${colour}" fill="${colour}">
<text transform="translate(${x_label},${y_label}) scale(0.8,1)" x="0" y="0"${font_size} stroke="none">${label}</text>
<circle cx="${x}" cy="${y}" r="${r}" fill="url(#grad_${continent})"/>
<circle cx="${x}" cy="${y}" r="2" fill-opacity="0.5"/>
<path d="M ${x} ${y} H ${x_margin}" stroke-width="0.5" stroke-opacity="0.5"/>
</g>`;
}
}
}
$y = 35;
foreach (@continent_order) {
$count = $continents{$_}{"count"};
if ($count > 0) {
$colour = $continents{$_}{"colour"};
$name = $continents{$_}{"name"};
$out_grad .= qq`
<radialGradient id="grad_${_}" cx="50%" cy="50%" r="50%" fx="25%" fy="25%">
<stop offset="50%" stop-color="${colour}" stop-opacity="0"/>
<stop offset="100%" stop-color="${colour}" stop-opacity="0.5"/>
</radialGradient>`;
$out_legend .= qq`
<text transform="translate(70,${y}) scale(0.8,1)" x="0" y="10" fill="${colour}"><tspan>${name}</tspan><tspan x="280" text-anchor="end">(${count})</tspan></text>
<circle cx="40" cy="${y}" r="20" stroke="${colour}" fill="url(#grad_${_})"/>
<circle cx="40" cy="${y}" r="2" stroke="${colour}"/>`;
$y += 50;
}
}
for ($mag = $mag_max; $mag >= $mag_min; $mag -= 0.1) {
$x = &x($mag);
$mag = sprintf("%0.1f", $mag);
$out_grid .= qq`
<use xlink:href="#grid_x" transform="translate(${x},0)"/>`;
if ($mag < $mag_max) {
$out_grid .= qq`
<text transform="translate(${x},-5) scale(0.8,1)" x="0" y="0" text-anchor="middle">${mag}</text>`;
}
}
for ($date = $date_max; $date >= $date_min; $date -= 5) {
$y = &y($date);
if ($date > $date_min) {
$out_grid .= qq`
<use xlink:href="#grid_y_5" transform="translate(0,${y})"/>`;
if ($date < $date_max) {
$out_grid .= qq`
<text transform="translate(-5,${y}) scale(0.8,1)" x="0" y="10" text-anchor="end">${date}</text>`;
}
} else {
$out_grid .= qq`
<text transform="translate(-5,${y}) scale(0.8,1)" x="0" y="15" text-anchor="end">${date}</text>`;
}
}
open (FILE_OUT, ">$file_out");
print FILE_OUT qq`<?xml version="1.0" encoding="utf-8"?>
<svg xmlns="http://www.w3.org/2000/svg" xmlns:xlink="http://www.w3.org/1999/xlink" width="100%" height="100%" viewBox="${x_viewbox} ${y_viewbox} ${width_viewbox} ${height_viewbox}">
<title>Magnitude 8.0 and greater earthquakes since 1900</title>
<desc>Earthquakes of moment magnitude 8.0 and greater since 1900, charted by CMG Lee. The apparent 3D volumes of the bubbles are linearly proportional to their respective fatalities, i.e. their radii are linearly proportional to the cube root of the fatalities. Data is from https://earthquake.usgs.gov/earthquakes/eqarchives/year/mag8/magnitude8_1900_date.php , http://comcat.cr.usgs.gov/earthquakes/eventpage/usc000f1s0 and http://comcat.cr.usgs.gov/earthquakes/eventpage/usb000h4jh .</desc>
<defs>${out_grad}
<path id="grid_x" d="M 0 ${y_min} V ${y_max}"/>
<path id="grid_y" d="M ${x_min} 0 h -1 H ${x_max}"/>
<path id="grid_y_tick" d="M ${x_min} 0 h -2 H ${x_max}" stroke-width="2"/>
<g id="grid_y_5">
<use xlink:href="#grid_y_tick"/>
<use xlink:href="#grid_y" transform="translate(0,-10)"/>
<use xlink:href="#grid_y" transform="translate(0,-20)"/>
<use xlink:href="#grid_y" transform="translate(0,-30)"/>
<use xlink:href="#grid_y" transform="translate(0,-40)"/>
</g>
</defs>
<rect x="${x_viewbox}" y="${y_viewbox}" width="${width_viewbox}" height="${height_viewbox}" fill="#ffffff"/>
<g font-family="sans-serif" letter-spacing="-2" font-size="28" text-anchor="start">
<g stroke="#cccccc" fill="#000000">${out_grid}
<path d="M 0 ${y_max} V 0 H ${x_max}" stroke="#000000" fill="none"/>
</g>
<g transform="scale(0.8,1)" fill="#666666">
<text x="-55" y="1195">Year</text>
<text x="1340" y="-5">Magnitude</text>
</g>
<g transform="translate(${x_legend},${y_legend})">
<rect x="0" y="0" width="${w_legend}" height="${h_legend}" rx="20" ry="20" stroke="#000000" fill="#ffffff"/>${out_legend}
</g>
${out_graph}
</g>
</svg>
<!${double_dash} Perl script to create above; please do not remove.
`;
open (FILE_IN, $0);
while (<FILE_IN>) { print FILE_OUT $_; }
close FILE_IN;
print FILE_OUT "# ${double_dash}>";
close FILE_OUT;
#
|
Este gráfico vectorial fue creado con perl
Licencia
Yo, titular de los derechos de autor de esta obra, la publico en los términos de las siguientes licencias:
Este archivo se encuentra bajo la licencia Creative Commons Genérica de Atribución/Compartir-Igual 3.0.
- Eres libre:
- de compartir – de copiar, distribuir y transmitir el trabajo
- de remezclar – de adaptar el trabajo
- Bajo las siguientes condiciones:
- atribución – Debes otorgar el crédito correspondiente, proporcionar un enlace a la licencia e indicar si realizaste algún cambio. Puedes hacerlo de cualquier manera razonable pero no de manera que sugiera que el licenciante te respalda a ti o al uso que hagas del trabajo.
- compartir igual – En caso de mezclar, transformar o modificar este trabajo, deberás distribuir el trabajo resultante bajo la misma licencia o una compatible como el original.

|
Se autoriza la copia, distribución y modificación de este documento bajo los términos de la licencia de documentación libre GNU, versión 1.2 o cualquier otra que posteriormente publique la Fundación para el Software Libre; sin secciones invariables, textos de portada, ni textos de contraportada. Se incluye una copia de la dicha licencia en la sección titulada Licencia de Documentación Libre GNU. |
Puedes usar la licencia que prefieras.
Historial del archivo
Haz clic sobre una fecha y hora para ver el archivo tal como apareció en ese momento.
| Fecha y hora | Miniatura | Dimensiones | Usuario | Comentario | |
|---|---|---|---|---|---|
| actual | 07:53 7 oct 2018 | | 512 × 512 (112 kB) | JoKalliauer | Inkscape: --verb=SelectionUnGroup (inkscape --verb=EditSelectAll --verb=SelectionUnGroup --verb=SelectionUnGroup --verb=SelectionUnGroup --verb=SelectionUnGroup --verb=SelectionUnGroup --verb=FileSave --verb=FileClose ./${file}u.svg --verb=FileQuit) |
| 22:04 6 oct 2018 |  | 512 × 512 (40 kB) | JoKalliauer | try to simplify file | |
| 18:47 5 oct 2018 |  | 512 × 512 (61 kB) | Cmglee | Try to fix bubbles. | |
| 18:18 4 oct 2018 |  | 512 × 512 (61 kB) | Cmglee | Update up to 2018-10-04. | |
| 23:21 2 abr 2015 |  | 512 × 512 (60 kB) | Cmglee | Add 2014 quake, axis labels (w:user_talk:cmglee#Earthquake_graph) and minor cosmetic changes. | |
| 12:13 3 jul 2013 |  | 512 × 512 (60 kB) | Cmglee | Add 2013 quakes and minor cosmetic changes. | |
| 22:48 13 abr 2012 |  | 512 × 512 (59 kB) | Cmglee | Add counts to legend and refine more labels. | |
| 22:09 13 abr 2012 |  | 512 × 512 (59 kB) | Cmglee | Refine labels. | |
| 21:16 13 abr 2012 |  | 512 × 512 (58 kB) | Cmglee | Add magnitude 8.0 to 8.4 earthquakes to match filename. | |
| 19:24 13 abr 2012 |  | 512 × 512 (23 kB) | Cmglee | Shorten label to fit. |
Usos del archivo
No hay páginas que enlacen a este archivo.
Uso global del archivo
Las wikis siguientes utilizan este archivo:
- Uso en am.wikipedia.org
- Uso en ar.wikipedia.org
- Uso en en.wikipedia.org
- Uso en fa.wikipedia.org
- Uso en gl.wikipedia.org
- Uso en hu.wikipedia.org
- Uso en id.wikipedia.org
- Uso en ko.wikipedia.org
- Uso en mnw.wikipedia.org
- Uso en ms.wikipedia.org
- Uso en pa.wikipedia.org
- Uso en pt.wikipedia.org
- Uso en tr.wikipedia.org
- Uso en uk.wikipedia.org
- Uso en zh.wikipedia.org