
Archivo:Wavestats.svg

Tamaño de esta previsualización PNG del archivo SVG: 741 × 336 píxeles. Otras resoluciones: 320 × 145 píxeles · 640 × 290 píxeles · 1024 × 464 píxeles · 1280 × 580 píxeles · 2560 × 1161 píxeles.
Ver la imagen en su resolución original ((Imagen SVG, nominalmente 741 × 336 pixels, tamaño de archivo: 19 kB))
Resumen
| Descripción |
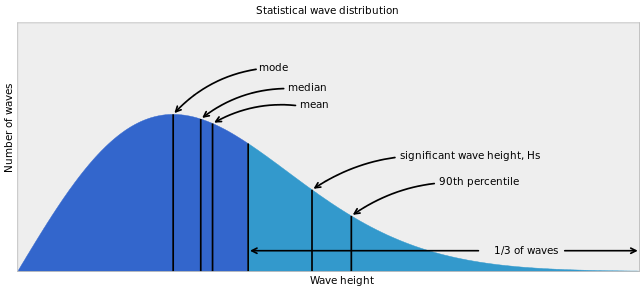
English: Wave Statistics |
| Fuente |
|
| Autor | NOAA |
| SVG desarrollo | El código fuente de esta imagen SVG es válido. Este gráfico vectorial fue creado con Matplotlib/Adobe. This plot uses embedded text that can be easily translated using a text editor. |
| Código fuente | Python codeimport numpy as np
import scipy.stats
import matplotlib.pyplot as plt
maxx = 8.0
rc('text.latex', preamble='\usepackage{sfmath}')
rc('text', usetex=True)
rc('font', family='sans-serif')
x = np.arange(0,maxx,0.01)
rayl = scipy.stats.rayleigh(loc=0,scale=2)
p = rayl.pdf(x)
x67 = rayl.ppf(2/3.0)
idx0_67 = x < x67
maxidx = np.max(np.where(idx0_67)[0])
idx67_0 = x >= x67
idx67_0[maxidx] = True
fig = plt.figure(figsize=(10,4))
ax = fig.add_axes([0,0,1,1],frameon=True)
ax.set_ylim(0,0.48)
ax.set_xlim(0, maxx)
ax.fill_between(x[idx0_67],np.zeros(p.shape)[idx0_67], p[idx0_67], alpha=0.5, color=(0.2,0.4,0.8))
ax.fill_between(x[idx67_0],np.zeros(p.shape)[idx67_0], p[idx67_0], alpha=0.5, color=(0.2,0.6,0.8))
ax.vlines(x67, 0, rayl.pdf(x67), linewidth=2, alpha=0.5)
ax.vlines(rayl.kwds['scale'], 0, rayl.pdf(rayl.kwds['scale']), linewidth=2, alpha=0.5)
ax.annotate("mode",
xy=(rayl.kwds['scale'], rayl.pdf(rayl.kwds['scale'])), xycoords='data',
xytext=(100, 50), textcoords='offset points',
va="bottom", ha="left",
arrowprops=dict(arrowstyle="->",
connectionstyle="arc3,rad=0.2",
mutation_scale=15,
linewidth=2,
edgecolor='black'
),
fontsize='large')
ax.vlines(rayl.median(), 0, rayl.pdf(rayl.median()), linewidth=2, alpha=0.5)
ax.annotate("median",
xy=(rayl.median(), rayl.pdf(rayl.median())), xycoords='data',
xytext=(100, 30), textcoords='offset points',
va="bottom", ha="left",
arrowprops=dict(arrowstyle="->",
connectionstyle="arc3,rad=0.2",
mutation_scale=15,
linewidth=2,
edgecolor='black'
),
fontsize='large')
ax.vlines(rayl.mean(), 0, rayl.pdf(rayl.mean()), linewidth=2, alpha=0.5)
ax.annotate(r"mean, $\bar{H}$",
xy=(rayl.mean(), rayl.pdf(rayl.mean())), xycoords='data',
xytext=(100, 10), textcoords='offset points',
va="bottom", ha="left",
arrowprops=dict(arrowstyle="->",
connectionstyle="arc3,rad=0.2",
mutation_scale=15,
linewidth=2,
edgecolor='black'
),
fontsize='large')
ax.vlines(rayl.ppf(5/6.0), 0, rayl.pdf(rayl.ppf(5/6.0)), linewidth=2, alpha=0.5)
ax.annotate("significant wave height, $H_{S}$",
xy=(rayl.ppf(5/6.0), rayl.pdf(rayl.ppf(5/6.0))), xycoords='data',
xytext=(100, 30), textcoords='offset points',
va="bottom", ha="left",
arrowprops=dict(arrowstyle="->",
connectionstyle="arc3,rad=0.2",
mutation_scale=15,
linewidth=2,
edgecolor='black'
),
fontsize='large')
ax.vlines(rayl.ppf(9/10.0), 0, rayl.pdf(rayl.ppf(9/10.0)), linewidth=2, alpha=0.5)
ax.annotate("90th percentile, $H_{1/10}$",
xy=(rayl.ppf(9/10.0), rayl.pdf(rayl.ppf(9/10.0))), xycoords='data',
xytext=(100, 30), textcoords='offset points',
va="bottom", ha="left",
arrowprops=dict(arrowstyle="->",
connectionstyle="arc3,rad=0.2",
mutation_scale=15,
linewidth=2,
edgecolor='black'
),
fontsize='large')
center = (maxx+rayl.ppf(2/3.0))/2.0+1
ax.text(center, 0.04, '1/3 of waves', ha='center', va='center', fontsize='large')
arrow = matplotlib.patches.FancyArrowPatch(
posA=(rayl.ppf(4/6.0), 0.04), posB=(center, 0.04), arrowstyle='<-',
mutation_scale=15.0, linewidth=2, edgecolor='black',
shrinkB=50
)
ax.add_patch(arrow)
arrow = matplotlib.patches.FancyArrowPatch(
posA=(center, 0.04), posB=(maxx, 0.04), arrowstyle='->',
mutation_scale=15.0, linewidth=2, edgecolor='black',
shrinkA=50
)
ax.add_patch(arrow)
ax.set_xlabel('wave height', size='x-large')
ax.set_xticks([])
ax.set_ylabel('number of waves',size='x-large')
ax.set_yticks([])
ax.set_title('Statistical wave distribution')
|
Licencia
Esta imagen es de dominio público porque contiene material que vino originalmente de la Administración Nacional Oceánica y Atmosférica de los Estados Unidos de América, recibidas o hechas en el curso de las funciones oficiales de un empleado.
|
Registro original de carga
Transferido desde en.wikipedia a Commons por SiggyF usando CommonsHelper.
Aquí se muestra la página de descripción original. Los siguientes nombres de usuario se refieren a en.wikipedia.
- 2009-12-09 15:06 Hurricaneg 500×300× (10286 bytes) {{Information |Description = Wave Statistics |Source = NOAA UCAR COMET Program |Date = ~~~~~ |Author = COMET PROGRAM |Permission = Public |other_versions = n/a }}
Historial del archivo
Haz clic sobre una fecha y hora para ver el archivo tal como apareció en ese momento.
| Fecha y hora | Miniatura | Dimensiones | Usuario | Comentario | |
|---|---|---|---|---|---|
| actual | 21:15 1 ago 2012 | | 741 × 336 (19 kB) | SiggyF | {{Information |Description={{en|Wave Statistics}} |Source=Transferred from [http://en.wikipedia.org en.wikipedia]; transferred to Commons by User:SiggyF using [http://tools.wikimedia.de/~magnus/commonshelper.php CommonsHelper].<br/> Regenerated usi... |
Usos del archivo
La siguiente página usa este archivo:
Uso global del archivo
Las wikis siguientes utilizan este archivo:
- Uso en en.wikipedia.org
- Uso en fa.wikipedia.org
- Uso en fi.wikipedia.org
- Uso en nl.wikipedia.org
- Uso en pt.wikipedia.org