
Archivo:Halogenated gas concentrations 1978-present.png
Tamaño de esta previsualización: 800 × 516 píxeles. Otras resoluciones: 320 × 206 píxeles · 640 × 412 píxeles · 928 × 598 píxeles.
Ver la imagen en su resolución original (928 × 598 píxeles; tamaño de archivo: 24 kB; tipo MIME: image/png)
Resumen

|
Este archivo podría ser actualizado para indicar nueva información. Si desea utilizar una versión específica del archivo sin reflejar actualizaciones posteriores, suba la versión deseada como un archivo separado. |
| Descripción |
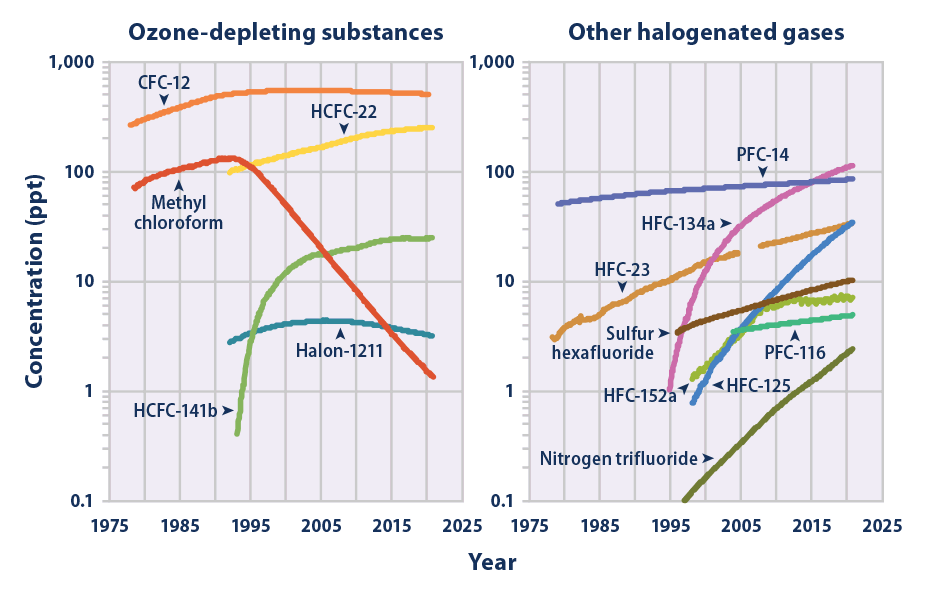
English: The two graphs show global changes in the concentration (measured in parts per trillion, or ppt) of several important halogenated gases in Earth's atmosphere. The data were collected from sites around the world between years 1978 and 2021. The left graph shows gases which cause substantial ozone depletion, as well as atmospheric heating. The right graph shows gases whose main impact is global warming.
All of the gases are human-made and manufactured in industrial amounts starting as early as the mid-twentieth century. Severe depletion of Earth's protective ozone layer inspired efforts to reduce the production of some gases starting the late 1980s. Overall, the manufacture of most other gases is still rapidly increasing, as indicated by the logarithmic scale used to graph the concentrations. Data Sources/References:
|
| Fecha | |
| Fuente | https://www.epa.gov/climate-indicators/climate-change-indicators-atmospheric-concentrations-greenhouse-gases |
| Autor | United States Environmental Protection Agency - Unauthored |
Licencia
Esta imagen es de dominio público porque contiene material que vino originalmente de la Administración Nacional Oceánica y Atmosférica de los Estados Unidos de América, recibidas o hechas en el curso de las funciones oficiales de un empleado.
|
Historial del archivo
Haz clic sobre una fecha y hora para ver el archivo tal como apareció en ese momento.
| Fecha y hora | Miniatura | Dimensiones | Usuario | Comentario | |
|---|---|---|---|---|---|
| actual | 06:37 29 ago 2022 | | 928 × 598 (24 kB) | A876 | updated by author to cover 1978-2021. |
| 00:03 15 abr 2022 |  | 928 × 598 (24 kB) | A876 | compacted. octree from RGB (3348 colors) (no noticeable change) to 256 colors. zopfli png compression (lossless). | |
| 23:49 14 abr 2022 |  | 928 × 598 (74 kB) | A876 | updated by author to cover 1978-2018. (includes ALL of the previous version (1978-2015), so REPLACING it is no loss.) | |
| 17:05 25 sep 2020 |  | 928 × 598 (77 kB) | Bikesrcool | Uploaded a work by United States Environmental Protection Agency - Unauthored from https://www.epa.gov/climate-indicators/climate-change-indicators-atmospheric-concentrations-greenhouse-gases with UploadWizard |
Usos del archivo
Las siguientes páginas usan este archivo:
Uso global del archivo
Las wikis siguientes utilizan este archivo:
- Uso en bn.wikipedia.org
- Uso en en.wikipedia.org
- Uso en fr.wikipedia.org
- Uso en it.wikipedia.org
- Uso en zh.wikipedia.org