
Archivo:Correlation examples.png

Tamaño de esta previsualización: 800 × 336 píxeles. Otras resoluciones: 320 × 134 píxeles · 824 × 346 píxeles.
Ver la imagen en su resolución original (824 × 346 píxeles; tamaño de archivo: 15 kB; tipo MIME: image/png)
| Descripción | See below. |
| Fecha | 8 de diciembre de 2007 (fecha original de carga) |
| Fuente |
Transferido desde en.wikipedia a Commons por jtneill. Este diagrama fue creado con Mathematica |
| Autor | Imagecreator de Wikipedia en inglés |
| Otras versiones | File:CovrarianceCorrelation.svg, File:Correlation examples2.svg |

|
File:Correlation examples2.svg es una versión vectorial de este archivo. Debería usarse esa versión en lugar de este archivo PNG, cuando sea mejor.
File:Correlation examples.png → File:Correlation examples2.svg
Para más información, lee Ayuda:SVG. |
 |
|
|
[[:File:CovrarianceCorrelaخن
tion.svg]] es una versión vectorial de este archivo.
Error: No existe un archivo con ese nombre. Asegúrate de usar el formato correcto: {{vector version available|nombre de nueva imagen.svg}}. File:Correlation examples.png → [[:File:CovrarianceCorrelaخن
tion.svg]]
Para más información, lee Ayuda:SVG. |
[[File:CovrarianceCorrelaخن
tion.svg|Nueva imagen SVG|150x150px]] |
Resumen
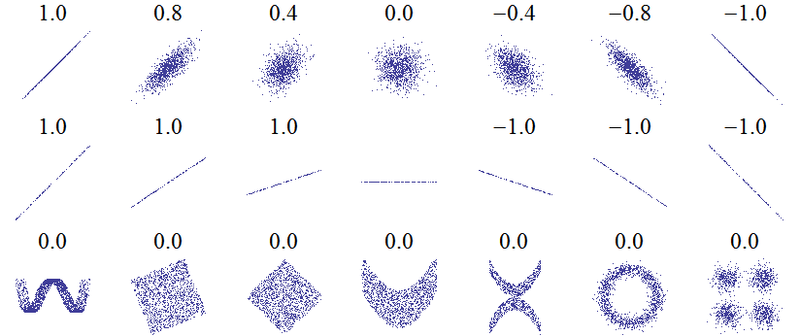
An example of the correlation of x and y for various distributions of (x,y) pairs. It was created by this Mathematica 6 code, which I wrote and release into the public domain (needs makePlot!):
n = 2000;
GraphicsArray[{
  Table[makePlot[
    Table[{RandomReal[NormalDistribution[0, 1]], (1 - Abs[w])*
        RandomReal[NormalDistribution[0, 1]]} .
      RotationMatrix[-Sign[w]*Pi/4], {i, -1, 1, 2./n}], 1000], {w,
    1, -1, -1/3}],
  Table[makePlot[Table[{x, slope*x}, {x, -1, 1, 2./n}], 100], {slope,
    1, -1, -1/3}],
  {
   makePlot[
    Table[{x + RandomReal[]/3,
      4 (x^2 - 1/2)^2 + RandomReal[]/500} , {x, -1, 1, 2./n}], 2000],
   makePlot[
    Table[{RandomReal[{-1, 1}], RandomReal[{-1, 1}]} .
      RotationMatrix[-Pi/8], {x, -1, 1, 2./n}], 1400],
   makePlot[
    Table[{RandomReal[{-1, 1}], RandomReal[{-1, 1}]} .
      RotationMatrix[-Pi/4], {x, -1, 1, 2./n}], 1400],
   makePlot[Table[{x, x^2 + RandomReal[]}/2, {x, -1, 1, 2./n}],
    1400],
   makePlot[
    Table[{x, x^2 + RandomReal[]/2}*(RandomInteger[1]*2 - 1), {x, -1,
      1, 2./n}], 1000],
   makePlot[
    Table[{Sin[x*Pi] + RandomReal[NormalDistribution[0, 1/8]],
      Cos[x*Pi] + RandomReal[NormalDistribution[0, 1/8]]}, {x, -1, 1,
      2./n}], 1400],
   makePlot[
    Table[{RandomReal[NormalDistribution[0, 1/3]],
       RandomReal[
        NormalDistribution[0, 1/3]]} + {RandomInteger[1]*2 - 1,
       RandomInteger[1]*2 - 1}, {x, -1, 1, 2./n}], 1400]
   }
  }]
Licencia
| Este trabajo ha sido liberado al dominio público por su autor, Imagecreator de Wikipedia en inglés. Esto aplica para todo el mundo. En algunos países esto puede no ser legalmente factible; si ello ocurriese: Imagecreator otorga a cualquier persona el derecho de usar este trabajo para cualquier propósito, sin ningún tipo de condición, a menos que éstas sean requeridas por la ley. |
Registro original de carga
Aquí se muestra la página de descripción original. Los siguientes nombres de usuario se refieren a en.wikipedia.
- 2007-12-08 19:16 Imagecreator 824×346×8 (20371 bytes) == Summary == An example of the correlation of x and y for various distributions of (x,y) pairs. It was created by this Mathematica 6 code, which I wrote and release into the public domain: <pre> (*Several sets of (x,y) points, with the correlation coef
- 2007-12-08 18:48 Imagecreator 824×346×8 (21374 bytes) An example of the correlation of x and y for various distributions of (x,y) pairs. It was created by this Mathematica 6 code, which I wrote and release into the public domain: (*Several sets of (x,y) points, with the correlation coefficient of x \ and y
Historial del archivo
Haz clic sobre una fecha y hora para ver el archivo tal como apareció en ese momento.
| Fecha y hora | Miniatura | Dimensiones | Usuario | Comentario | |
|---|---|---|---|---|---|
| actual | 09:33 2 feb 2010 | | 824 × 346 (15 kB) | JBW | Removing "0.0" for correlation coefficient from horizontal line: here corr. coeff. is undefined. |
| 10:27 18 mar 2008 |  | 824 × 346 (20 kB) | Jtneill | {{Information |Description={{en|An example of the correlation of x and y for various distributions of (x,y) pairs. It was created by this Mathematica 6 code, which I wrote and release into the public domain: n = 2000; GraphicsArray[{ Table[makePlot[ |
Usos del archivo
No hay páginas que enlacen a este archivo.
Uso global del archivo
Las wikis siguientes utilizan este archivo:
- Uso en ar.wikipedia.org
- Uso en bg.wikipedia.org
- Uso en de.wikipedia.org
- Uso en de.wikibooks.org
- Mathematrix: AT BRP/ Theorie/ Reifeniveau 6
- Mathematrix: MA TER/ Theorie/ Statistik und Wahrscheinlichkeitsrechnung
- Mathematrix: AT BRP/ Theorie nach Thema/ Statistik und Wahrscheinlichkeitsrechnung
- Mathematrix: AT AHS/ Theorie nach Thema/ Statistik und Wahrscheinlichkeitsrechnung
- Mathematrix: BY GYM/ Theorie nach Thema/ Statistik und Wahrscheinlichkeitsrechnung
- Uso en en.wikipedia.org
- Uso en hi.wikipedia.org
- Uso en it.wikipedia.org
- Uso en lt.wikipedia.org
- Uso en pl.wikipedia.org
- Uso en th.wikipedia.org
- Uso en tr.wikipedia.org