
Archivo:US timeline. Opioid deaths.jpg

Tamaño de esta previsualización: 800 × 600 píxeles. Otras resoluciones: 320 × 240 píxeles · 640 × 480 píxeles · 1024 × 768 píxeles · 1200 × 900 píxeles.
Ver la imagen en su resolución original (1200 × 900 píxeles; tamaño de archivo: 179 kB; tipo MIME: image/jpeg)
Resumen
| Descripción |
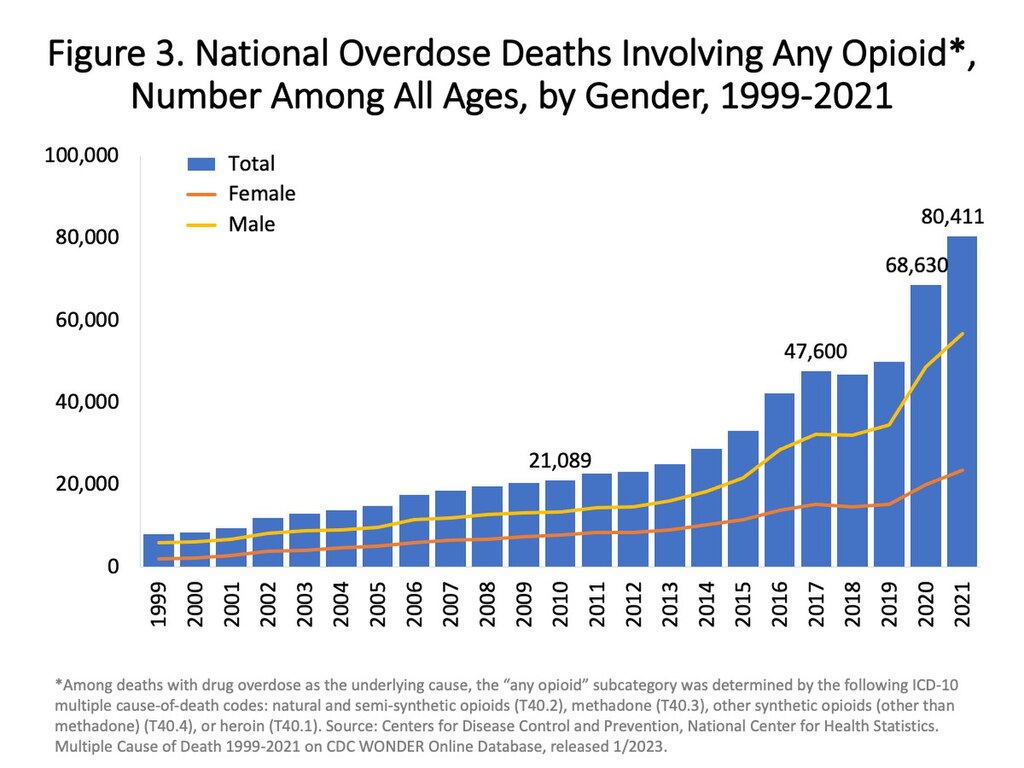
English: From source (emphasis and links added): "Figure 3. National Overdose Deaths Involving Any Opioid—Number Among All Ages, by Gender, 1999-2021. The figure above is a bar and line graph showing the total number of U.S. overdose deaths involving any opioid from 1999 to 2021. Any opioid includes prescription opioids (natural and semi-synthetic opioids and methadone), heroin, and synthetic opioids other than methadone (primarily fentanyl)). Opioid-involved overdose deaths rose from 21,089 in 2010 to 47,600 in 2017 and remained steady through 2019. This was followed by a significant increase in 2020 with 68,630 reported deaths and again in 2021 with 80,411 reported overdose deaths. The bars are overlaid by lines showing the number of deaths by gender from 1999 to 2021 (Source: CDC WONDER). |
||
| Fecha | - date of first upload to the Commons. See file history for dates of later uploads. | ||
| Fuente | Overdose Death Rates. By National Institute on Drug Abuse (NIDA). Click images there to enlarge, and then right-click and "open image in new tab". 1999-2021 chart. 1999-2019 chart. 1999-2017 chart from PDF with larger version of chart. 2002-2017 chart. 2002-2015 chart. | ||
| Autor | National Institute on Drug Abuse. On some versions of the chart freeware IrfanView was used to crop out the outer white space. And/or edit text at the top, and add a border. See Commons:Convert tables and charts to wiki code or image files, and the section about adding and editing text on chart images. | ||
| Otras versiones |
|


Licencia
This image is a work of the National Institutes of Health, part of the United States Department of Health and Human Services, taken or made as part of an employee's official duties. As a work of the U.S. federal government, the image is in the public domain.
 |
||
| Esta obra ha sido identificada como libre de las restricciones conocidas en virtud del derecho de autor, incluyendo todos los derechos conexos. | ||
Historial del archivo
Haz clic sobre una fecha y hora para ver el archivo tal como apareció en ese momento.
| Fecha y hora | Miniatura | Dimensiones | Usuario | Comentario | |
|---|---|---|---|---|---|
| actual | 20:26 12 jul 2023 | | 1200 × 900 (179 kB) | Jmabel | uploaded newer version at User:Timeshifter's request |
| 00:02 22 abr 2021 |  | 1118 × 706 (146 kB) | Timeshifter | Latest version. | |
| 16:13 17 ago 2019 |  | 1341 × 1037 (244 kB) | Timeshifter | Removed outer white space. Added "USA" and border. | |
| 17:19 26 abr 2019 |  | 1000 × 750 (116 kB) | Natureium | Updated version as of Dec 2018 | |
| 15:54 5 sep 2018 |  | 806 × 573 (88 kB) | Timeshifter | new version | |
| 13:51 29 oct 2017 |  | 848 × 629 (102 kB) | Timeshifter | Newer chart from same source. | |
| 10:07 27 mar 2017 |  | 849 × 630 (104 kB) | Timeshifter | User created page with UploadWizard |
Usos del archivo
Las siguientes páginas usan este archivo:
Uso global del archivo
Las wikis siguientes utilizan este archivo:
- Uso en ar.wikipedia.org
- Uso en azb.wikipedia.org
- Uso en bn.wikipedia.org
- Uso en ca.wikipedia.org
- Uso en cs.wikipedia.org
- Uso en da.wikipedia.org
- Uso en en.wikipedia.org
- Uso en et.wikipedia.org
- Uso en fi.wikipedia.org
- Uso en hy.wikipedia.org
- Uso en sr.wikipedia.org
- Uso en tr.wikipedia.org
- Uso en vi.wikipedia.org
- Uso en zh.wikipedia.org