
Archivo:Zeta polar.svg

Tamaño de esta previsualización PNG del archivo SVG: 560 × 480 píxeles. Otras resoluciones: 280 × 240 píxeles · 896 × 768 píxeles · 1195 × 1024 píxeles · 2389 × 2048 píxeles.
Ver la imagen en su resolución original ((Imagen SVG, nominalmente 560 × 480 pixels, tamaño de archivo: 9 kB))
W3C-validity not checked.
Resumen
| Descripción |
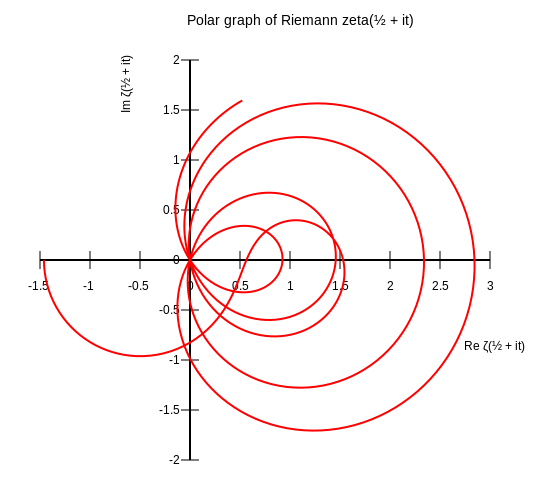
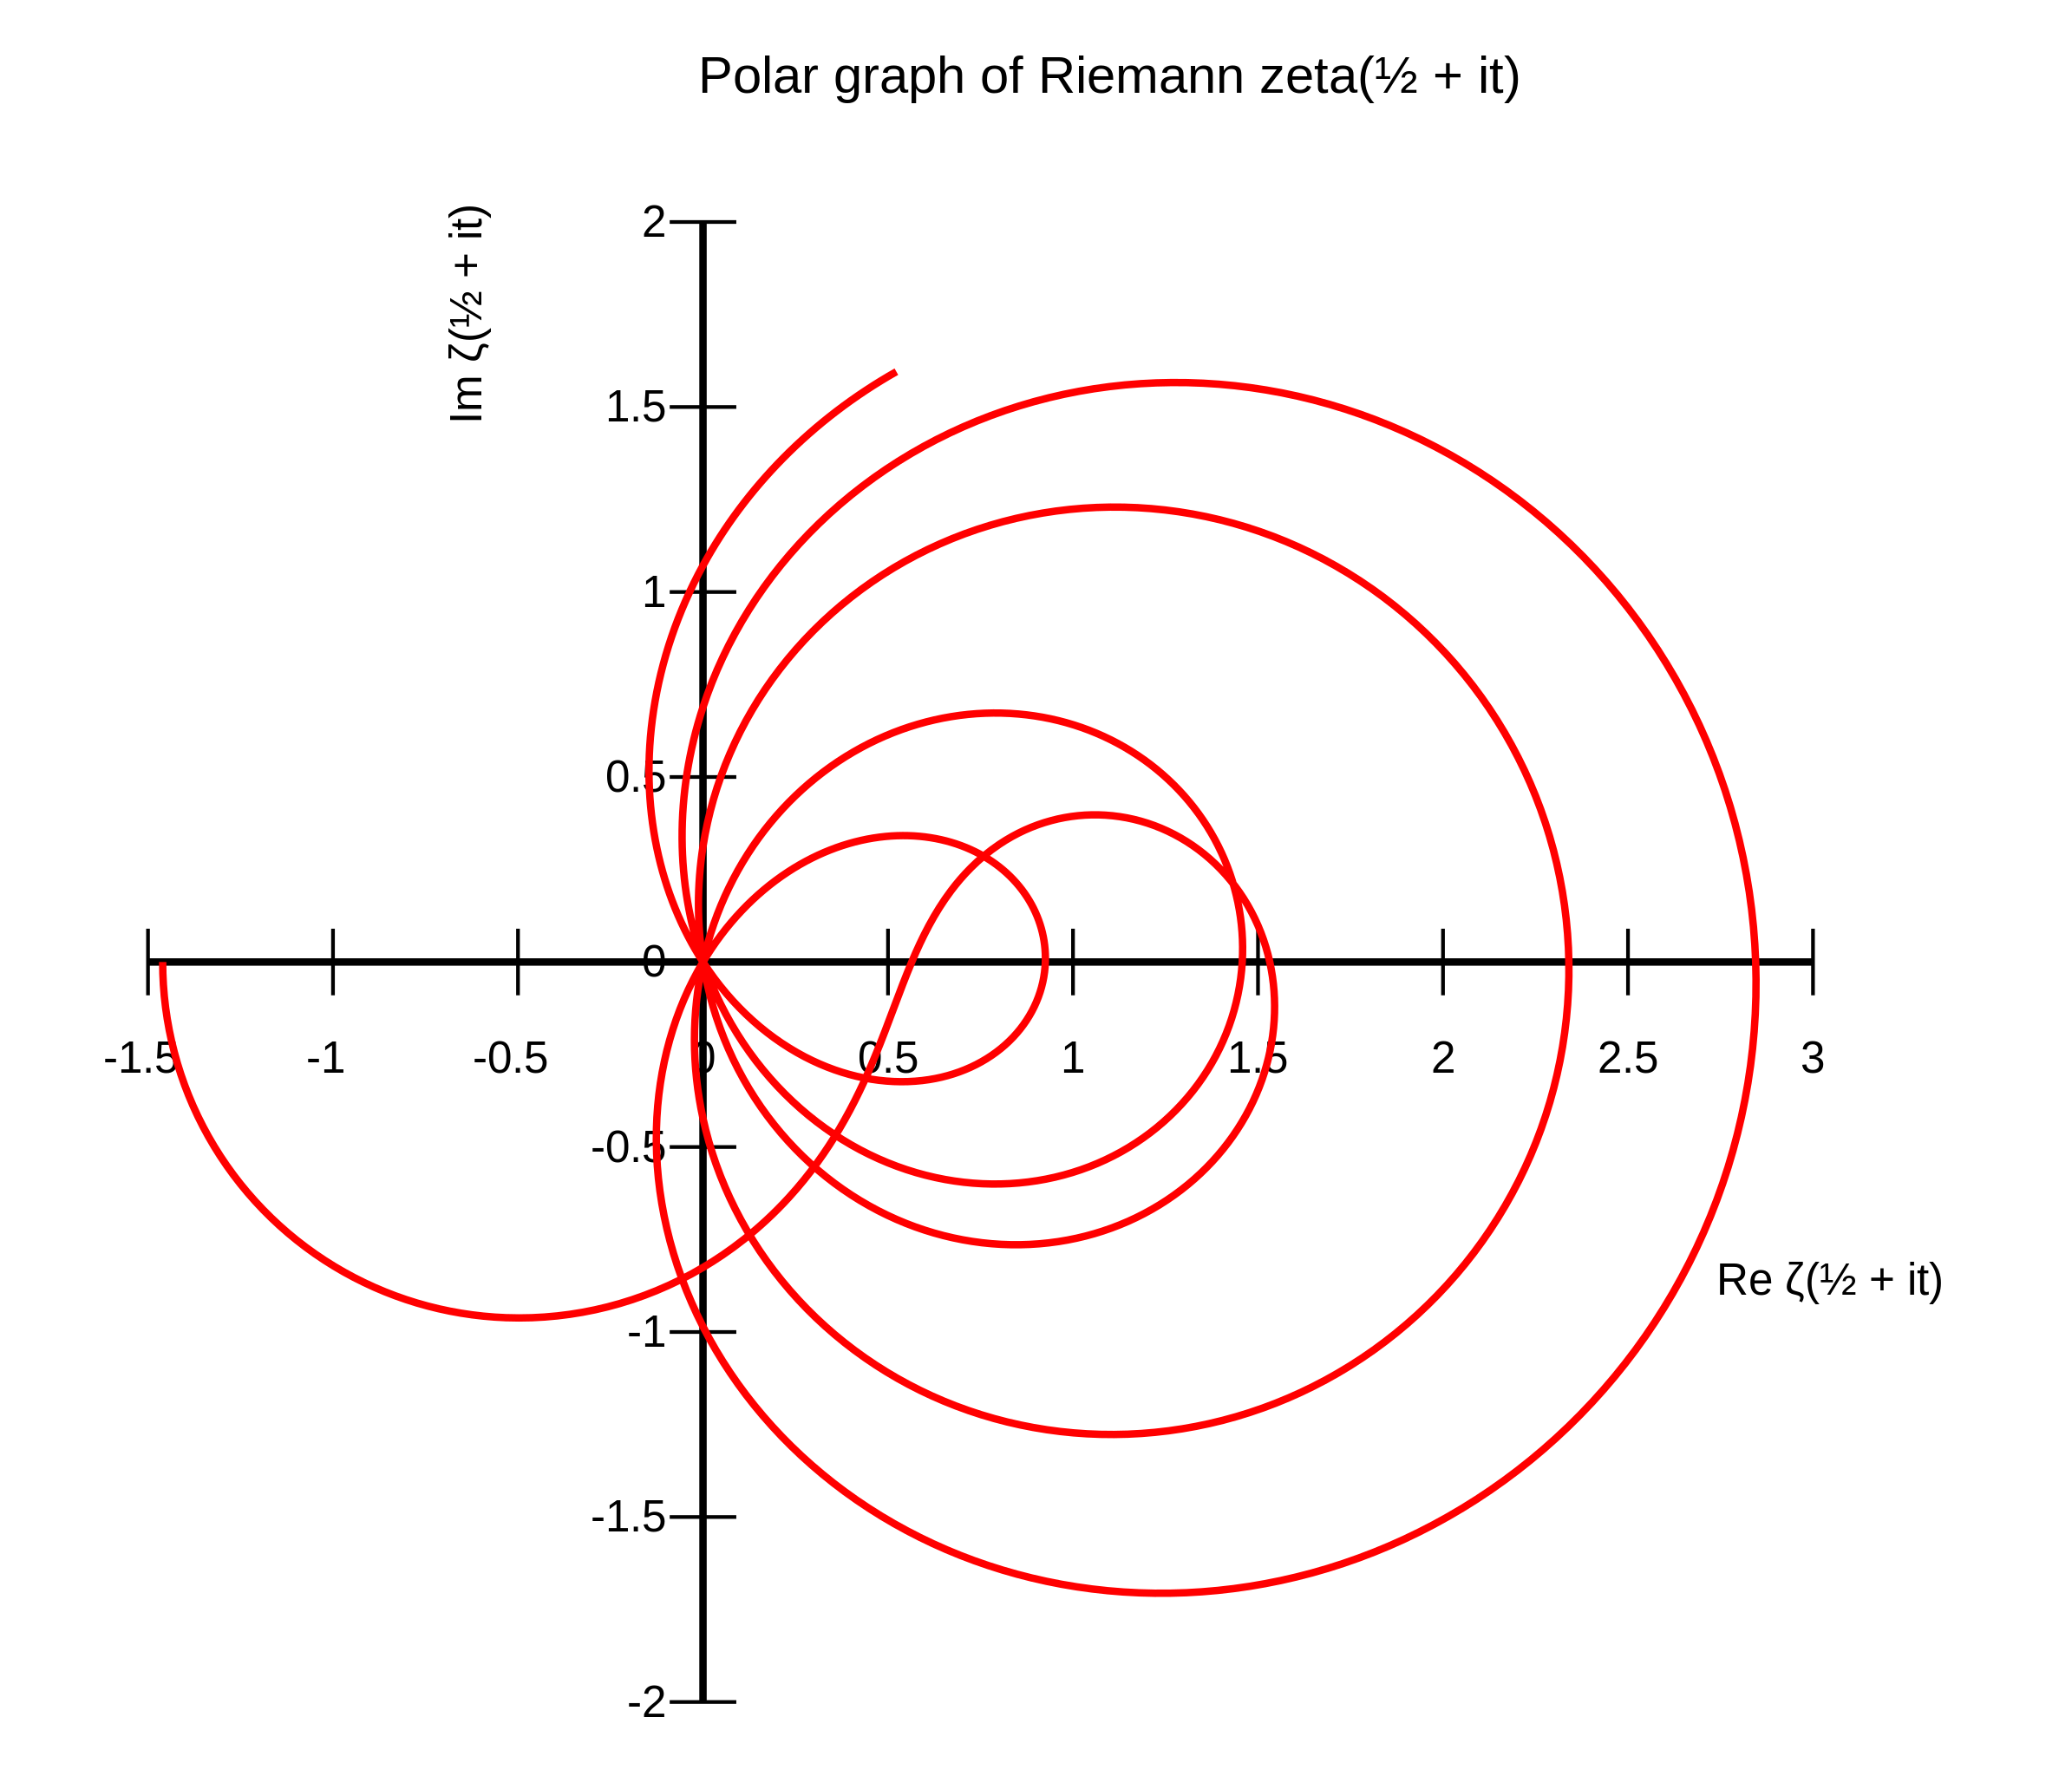
This image shows the path of the Riemann zeta function along the critical line. That is, it is a graph of versus for real values of t running from 0 to 34. The first five zeros in the critical strip are clearly visible as the place where the spirals pass through the origin. |
| Fecha | |
| Fuente | http://en.wikipedia.org/wiki/Image:Zeta_polar.svg |
| Autor |
|


Licencia

|
Se autoriza la copia, distribución y modificación de este documento bajo los términos de la licencia de documentación libre GNU, versión 1.2 o cualquier otra que posteriormente publique la Fundación para el Software Libre; sin secciones invariables, textos de portada, ni textos de contraportada. Se incluye una copia de la dicha licencia en la sección titulada Licencia de Documentación Libre GNU. |
| Este archivo se encuentra bajo la licencia Creative Commons Genérica de Atribución/Compartir-Igual 3.0. | ||
| ||
| Esta etiqueta de licencia fue agregada a este archivo como parte de la actualización de la licencia GFDL. |
Historial del archivo
Haz clic sobre una fecha y hora para ver el archivo tal como apareció en ese momento.
| Fecha y hora | Miniatura | Dimensiones | Usuario | Comentario | |
|---|---|---|---|---|---|
| actual | 11:34 12 ago 2010 | | 560 × 480 (9 kB) | Geek3 | header corrected for validator |
| 20:29 16 dic 2008 |  | 560 × 480 (10 kB) | Geek3 | smooth and precise plotcurve | |
| 14:15 22 may 2007 |  | 600 × 480 (11 kB) | Elisardojm | {{Information |Description=This image shows a polar graph of the Riemann zeta function along the critical line. That is, it is a graph of <math>\Re\zeta(it+1/2)</math> versus <math>\Im\zeta(it+1/2)</math> for real values of |
Usos del archivo
Las siguientes páginas usan este archivo:
Uso global del archivo
Las wikis siguientes utilizan este archivo:
- Uso en ar.wikipedia.org
- Uso en ast.wikipedia.org
- Uso en ca.wikipedia.org
- Uso en el.wikipedia.org
- Uso en en.wikipedia.org
- Uso en fr.wikipedia.org
- Uso en gl.wikipedia.org
- Uso en he.wikipedia.org
- Uso en id.wikipedia.org
- Uso en lt.wikipedia.org
- Uso en nl.wikipedia.org
- Uso en ro.wikipedia.org
- Uso en sl.wikipedia.org
- Uso en vi.wikipedia.org
- Uso en zh.wikipedia.org