
Archivo:Per-capita-co2-aviation-adjusted.svg

Ver la imagen en su resolución original ((Imagen SVG, nominalmente 850 × 600 pixels, tamaño de archivo: 168 kB))
Resumen
| Descripción |
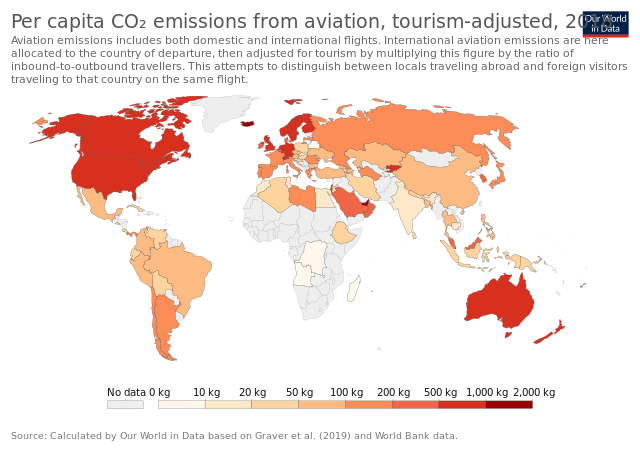
English: Per capita emissions from domestic and international flights
Let’s combine per capita emissions from domestic and international travel to compare the total footprint from flying. This is shown in the interactive map [we’ve taken the adjusted international figures – you can find the combined figures without tourism-adjustment here]. The global average emissions from aviation were 103 kilograms. The inequality in emissions across the world becomes clear when this is broken down by country. At the top of the table lies the United Arab Emirates – each person emits close to two tonnes – 1950 kg – of CO2 from flying each year. That’s 200 times the global average. This was followed by Singapore (1173 kilograms); Iceland (1070 kg); Finland (1000 kg); and Australia (878 kilograms). To put this into perspective: a return flight (in economy class) from London to Dubai/United Arab Emirates would emit around one tonne of CO2.6 So the two-tonne average for the UAE is equivalent to around two return trips to London. In many countries, most people do not fly at all. The average Indian emits just 18 kilograms from aviation – this is much, much less than even a short-haul flight which confirms that most did not take a flight. In fact, we can compare just the aviation emissions for the top countries to the total carbon footprint of citizens elsewhere. The average UAE citizen emits 1950 kilograms of CO2 from flying. This is the same as the total CO2 footprint of the average Indian (including everything from electricity to road transport, heating and industry). Or, to take a more extreme example, 200 times the total footprint of the average Nigerien, Ugandan or Ethiopian, which have per capita emissions of around 100 kilograms. This again emphasises the large difference between the global average and the individual emissions of people who fly. Aviation contributes a few percent of total CO2 emissions each year – this is not insignificant, but far from being the largest sector to tackle. Yet from the perspective of the individual, flying is often one of the largest chunks of our carbon footprint. The average rich person emits tonnes of CO2 from flying each year – this is equivalent to the total carbon footprint of tens or hundreds of people in many countries of the world. |
| Fecha | |
| Fuente | https://ourworldindata.org/carbon-footprint-flying |
| Autor | Hannah Ritchie |
Licencia
- Eres libre:
- de compartir – de copiar, distribuir y transmitir el trabajo
- de remezclar – de adaptar el trabajo
- Bajo las siguientes condiciones:
- atribución – Debes otorgar el crédito correspondiente, proporcionar un enlace a la licencia e indicar si realizaste algún cambio. Puedes hacerlo de cualquier manera razonable pero no de manera que sugiera que el licenciante te respalda a ti o al uso que hagas del trabajo.
- compartir igual – En caso de mezclar, transformar o modificar este trabajo, deberás distribuir el trabajo resultante bajo la misma licencia o una compatible como el original.
Historial del archivo
Haz clic sobre una fecha y hora para ver el archivo tal como apareció en ese momento.
| Fecha y hora | Miniatura | Dimensiones | Usuario | Comentario | |
|---|---|---|---|---|---|
| actual | 15:54 21 jul 2022 | | 850 × 600 (168 kB) | PJ Geest | Uploaded a work by Hannah Ritchie from https://ourworldindata.org/carbon-footprint-flying with UploadWizard |
Usos del archivo
Las siguientes páginas usan este archivo:
Uso global del archivo
Las wikis siguientes utilizan este archivo:
- Uso en de.wikipedia.org
- Uso en en.wikipedia.org
- Uso en zh.wikipedia.org