
Archivo:New Madrid and Wabash seizmic zones-USGS mod.png
Tamaño de esta previsualización: 547 × 599 píxeles. Otras resoluciones: 219 × 240 píxeles · 438 × 480 píxeles · 748 × 819 píxeles.
Ver la imagen en su resolución original (748 × 819 píxeles; tamaño de archivo: 430 kB; tipo MIME: image/png)
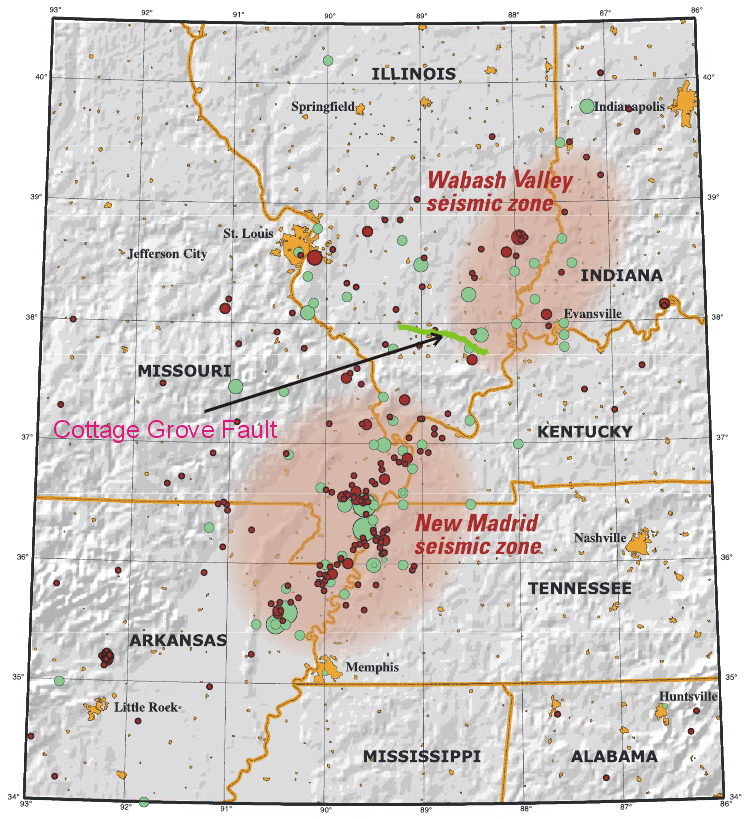
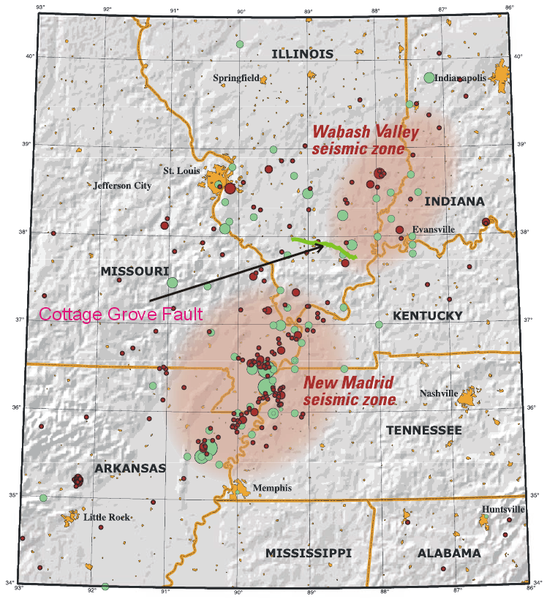
| Descripción | This map of the New Madrid and Wabash Valley seismic zones shows earthquakes as circles. Red circles indicate earthquakes that occurred from 1974 to 2002 with magnitudes larger than 2.5 located using modern instruments (University of Memphis). Green circles denote earthquakes that occurred prior to 1974 (USGS Professional Paper 1527). Larger earthquakes are represented by larger circles. The Cottage Grove Fault is indicated by the green line. |
| Fecha | (UTC) |
| Fuente | |
| Autor |
|
| Esta es una imagen retocada, lo que significa que ha sido alterada digitalmente de su versión original. Modificaciones: Added Cottage Fault. La original se puede ver aquí: New Madrid and Wabash seizmic zones-USGS.png. Las modificaciones las hizo Ruslik0.
|
Esta imagen está en el dominio público, ya que contiene materiales que originalmente vinieron del Servicio Geológico de los Estados Unidos de América, una agencia del Departamento del Interior. Para obtener más información, consulte la política oficial de derechos de los USGS.
|
Registro original de carga
This image is a derivative work of the following images:
- File:New_Madrid_and_Wabash_seizmic_zones-USGS.png licensed with PD-USGov-USGS
- 2008-04-25T02:30:32Z Kbh3rd 748x819 (478218 Bytes) {{Information |Description=This map of the New Madrid and Wabash Valley seismic zones shows earthquakes as circles. Red circles indicate earthquakes that occurred from 1974 to
Uploaded with derivativeFX
Historial del archivo
Haz clic sobre una fecha y hora para ver el archivo tal como apareció en ese momento.
| Fecha y hora | Miniatura | Dimensiones | Usuario | Comentario | |
|---|---|---|---|---|---|
| actual | 12:10 11 jun 2009 | | 748 × 819 (430 kB) | Ruslik0 | Improved version |
| 10:13 11 jun 2009 |  | 748 × 819 (431 kB) | Ruslik0 | {{Information |Description=This map of the New Madrid and Wabash Valley seismic zones shows earthquakes as circles. Red circles indicate earthquakes that occurred from 1974 to 2002 with magnitudes la |
Usos del archivo
La siguiente página usa este archivo:
Uso global del archivo
Las wikis siguientes utilizan este archivo:
- Uso en en.wikipedia.org
- Uso en pt.wikipedia.org
- Uso en tr.wikipedia.org
- Uso en uk.wikipedia.org
- Uso en zh.wikipedia.org