
Archivo:07 July - Percent of global area at temperature records - Global warming - NOAA.svg

Tamaño de esta previsualización PNG del archivo SVG: 800 × 560 píxeles. Otras resoluciones: 320 × 224 píxeles · 640 × 448 píxeles · 1024 × 717 píxeles · 1280 × 896 píxeles · 2560 × 1792 píxeles · 1000 × 700 píxeles.
Ver la imagen en su resolución original ((Imagen SVG, nominalmente 1000 × 700 pixels, tamaño de archivo: 5 kB))
Resumen
| Descripción |
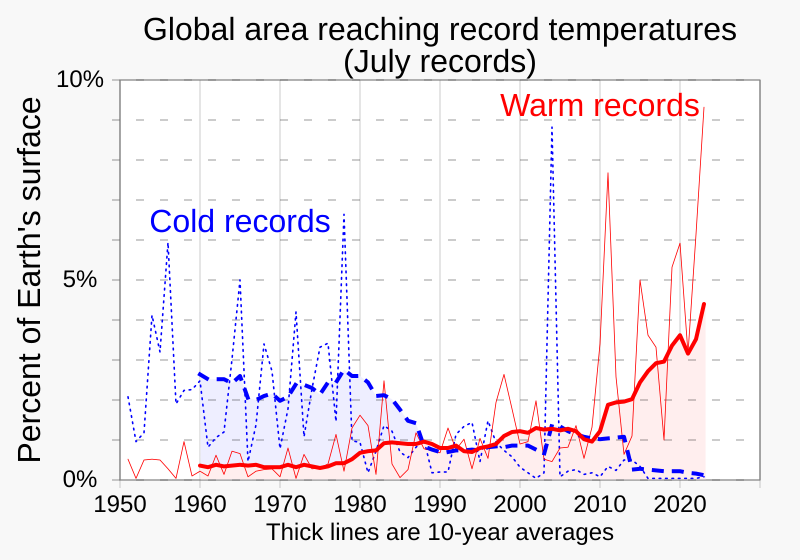
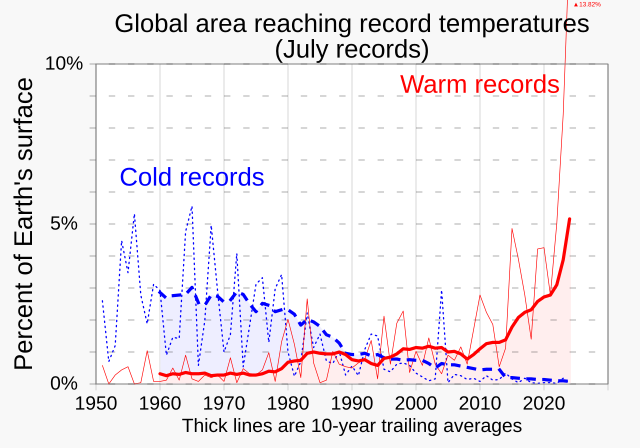
English: Line graphs of the percentages of Earth's surface reaching a record July temperature as a function of time over years 1951-, from NOAA data.
|
||
| Fecha | |||
| Fuente | Trabajo propio | ||
| Autor | RCraig09 |

Related files
-
 01 January - Percent of global area at temperature records - Global warming - NOAA.svg
(January data) -
 02 February - Percent of global area at temperature records - Global warming - NOAA.svg
(February data) -
 03 March - Percent of global area at temperature records - Global warming - NOAA.svg
(March data) -
 04 April - Percent of global area at temperature records - Global warming - NOAA.svg
(April data) -
 05 May - Percent of global area at temperature records - Global warming - NOAA.svg
(May data) -
 06 June - Percent of global area at temperature records - Global warming - NOAA.svg
(June data)


-
 07 July - Percent of global area at temperature records - Global warming - NOAA.svg
(July data) -
 08 August - Percent of global area at temperature records - Global warming - NOAA.svg
(August data) -
 09 September - Percent of global area at temperature records - Global warming - NOAA.svg
(September data) -
 10 October - Percent of global area at temperature records - Global warming - NOAA.svg
(October data) -
 11 November - Percent of global area at temperature records - Global warming - NOAA.svg
(November data) -
 12 December - Percent of global area at temperature records - Global warming - NOAA.svg
(December data)


-
 1951+ Percent of global area at temperature records - Seasonal comparison - NOAA.svg
Seasonal comparison -
 1951 - Percent of global area at temperature records (monthly) - Global warming - NOAA.svg
All months scatterplot/dot plot -
 1951- RATIO of new record warm temperatures to new record cold temperatures (monthly) - Global warming.svg
Ratios scatterplot/dot plot (monthly) -
 1951- Percent of record temperatures that are cold or warm records.svg
 -
 1951- Warm and cold record temperatures - bar chart.svg

_-_Global_warming_-_NOAA.svg)
_-_Global_warming.svg)


Licencia
Yo, el titular de los derechos de autor de esta obra, la publico en los términos de la siguiente licencia:
Este archivo está disponible bajo la licencia Creative Commons Attribution-Share Alike 4.0 International.
- Eres libre:
- de compartir – de copiar, distribuir y transmitir el trabajo
- de remezclar – de adaptar el trabajo
- Bajo las siguientes condiciones:
- atribución – Debes otorgar el crédito correspondiente, proporcionar un enlace a la licencia e indicar si realizaste algún cambio. Puedes hacerlo de cualquier manera razonable pero no de manera que sugiera que el licenciante te respalda a ti o al uso que hagas del trabajo.
- compartir igual – En caso de mezclar, transformar o modificar este trabajo, deberás distribuir el trabajo resultante bajo la misma licencia o una compatible como el original.
Historial del archivo
Haz clic sobre una fecha y hora para ver el archivo tal como apareció en ese momento.
| Fecha y hora | Miniatura | Dimensiones | Usuario | Comentario | |
|---|---|---|---|---|---|
| actual | 03:42 15 ago 2023 | | 1000 × 700 (5 kB) | RCraig09 | Version 20: update to include data through July 2023 |
| 03:54 29 jul 2023 |  | 1000 × 700 (7 kB) | RCraig09 | Version 9: centering some text strings . . . making "(July records)" more conspicuous | |
| 15:18 28 jul 2023 |  | 1000 × 700 (7 kB) | RCraig09 | Version 8: created new graphic for JULY figures.... but only through July 2021 . . . I plan to update when July 2023 data becomes available | |
| 16:47 15 jun 2023 |  | 1000 × 700 (9 kB) | RCraig09 | Version 7: arrange order of code to make horizontal gridlines appear in front of colored areas | |
| 22:09 25 may 2023 |  | 1000 × 700 (9 kB) | RCraig09 | Version 6: Add blue fill area . . . . simplify horizontal axis | |
| 15:50 25 may 2023 |  | 1000 × 750 (9 kB) | RCraig09 | Version 5: changed dark blue line to dashed line . . . . making read fill-area be under 10-year average (rather than under annual numbers which are not as smooth a trace) | |
| 05:15 25 may 2023 |  | 1000 × 750 (9 kB) | RCraig09 | Version 4: Add 10-year moving averages traces | |
| 18:50 24 may 2023 |  | 1000 × 750 (6 kB) | RCraig09 | Version 3: update to include data through April 2023 . . . . add shading under red trace | |
| 19:31 2 sep 2021 |  | 1000 × 750 (5 kB) | RCraig09 | Version 2: Amending title to be more descriptive | |
| 19:06 2 sep 2021 |  | 1000 × 750 (5 kB) | RCraig09 | Uploaded own work with UploadWizard |
Usos del archivo
La siguiente página usa este archivo:
Uso global del archivo
Las wikis siguientes utilizan este archivo:
- Uso en bn.wikipedia.org
- Uso en en.wikipedia.org
- Uso en fa.wikipedia.org
- Uso en ja.wikipedia.org
- Uso en no.wikipedia.org
- Uso en tr.wikipedia.org