
Archivo:VolatilityDJIA-scaled.jpg

Tamaño de esta previsualización: 800 × 534 píxeles. Otras resoluciones: 320 × 214 píxeles · 640 × 427 píxeles · 1024 × 684 píxeles · 1280 × 854 píxeles · 1600 × 1068 píxeles.
Ver la imagen en su resolución original (1600 × 1068 píxeles; tamaño de archivo: 855 kB; tipo MIME: image/jpeg)


Resumen
| Descripción |
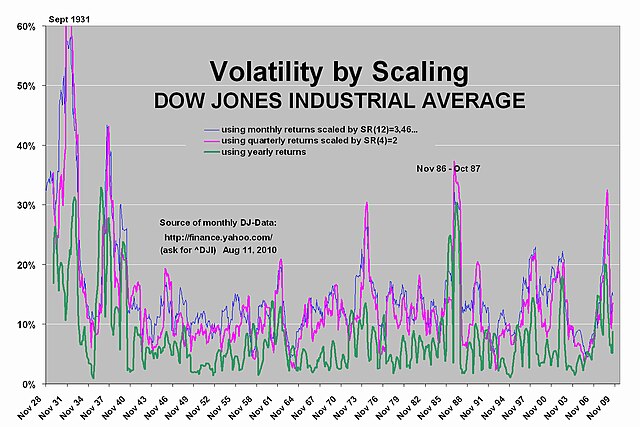
English: Show volatility of the Dow Jones Industrial Average Index since 1928, impact of the 30th, of 1987.
Proof that volatility can be and often is volatile itself. Computation: Standard deviation of monthly and quarterly returns scaled by square root of 12 or of 4 respectively. Standard deviation of yearly returns unscaled. Show that volatility scaling doesn't work for the Dow Jones Industrial Average Index from 1928 until 2010. Scaling by square root of 250 of daily returns may even lead to more errors presumably. |
| Fecha | |
| Fuente | Trabajo propio |
| Autor | Gaschroeder |
Licencia
| Yo, el titular de los derechos de autor de esta obra, lo libero al dominio público. Esto aplica en todo el mundo. En algunos países esto puede no ser legalmente factible; si ello ocurriese: Concedo a cualquier persona el derecho de usar este trabajo para cualquier propósito, sin ningún tipo de condición al menos que éstas sean requeridas por la ley. |
Historial del archivo
Haz clic sobre una fecha y hora para ver el archivo tal como apareció en ese momento.
| Fecha y hora | Miniatura | Dimensiones | Usuario | Comentario | |
|---|---|---|---|---|---|
| actual | 20:30 12 ago 2010 | | 1600 × 1068 (855 kB) | Gaschroeder | better resolution |
| 16:04 11 ago 2010 |  | 1518 × 882 (179 kB) | Gaschroeder | {{Information |Description={{en|1=Show volatility of the Dow Jones Industrial Average Index since 1928, impact of the 30th, of 1987. Proof that volatility can be and often is volatile itself. Computation: Standard deviation of monthly and quarterly return |
Usos del archivo
La siguiente página usa este archivo:
Uso global del archivo
Las wikis siguientes utilizan este archivo:
- Uso en de.wikipedia.org