
Archivo:IQ curve.svg

Tamaño de esta previsualización PNG del archivo SVG: 600 × 480 píxeles. Otras resoluciones: 300 × 240 píxeles · 960 × 768 píxeles · 1280 × 1024 píxeles · 2560 × 2048 píxeles.
Ver la imagen en su resolución original ((Imagen SVG, nominalmente 600 × 480 pixels, tamaño de archivo: 9 kB))
Resumen
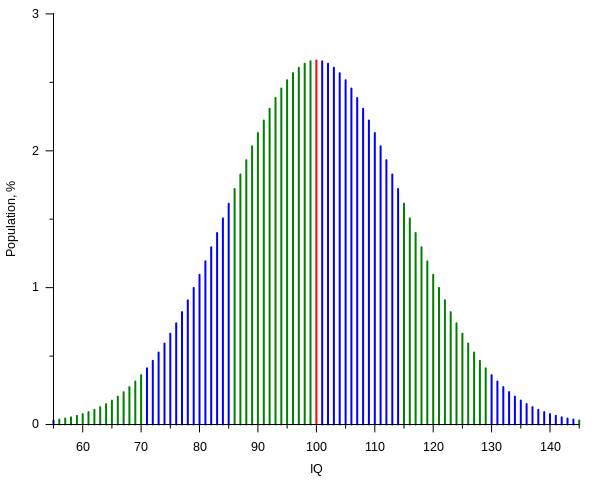
| Descripción | Current IQ tests typically have standard scores such that the mean score is 100 with each standard deviation from the mean counting for 15 IQ points.[1] The plot shows, assuming that such scores have a normal distribution, the percentage of people getting a score versus the score itself, from 55 to 145 IQ, that is over a span of six standard deviations. Spans are represented with different colors for each standard deviation above or below the mean. The plot was created with the following gnuplot code: |
| SVG desarrollo | |
| Código fuente | Gnuplot codeset terminal svg name 'IQ_curve' size 600,480 font ',10' rounded
set output 'IQ_curve.svg'
mu = 100.0
sigma = 15.0
from = 55
to = 145
# Normal distribution:
# (continuos normalization approximation, good to ~10 digits in this case)
P(x) = exp(-(x - mu)**2 / (2 * sigma**2)) / (sqrt(2 * pi) * sigma) * 100
# By sigma intervals:
oddsi(x) = (int(abs(x - mu) / sigma) % 2) ^ (x < mu)
Pm(x) = (x == mu) ? P(x) : 1/0 # sample at mu
Po(x) = ( oddsi(x) && (x != mu)) ? P(x) : 1/0 # samples in odd sigma intervals
Pe(x) = (!oddsi(x) && (x != mu)) ? P(x) : 1/0 # samples in even sigma intervals
set key off
set border 3
set xlabel 'IQ'
set xtics 10 out nomirror
set mxtics 2
set ylabel 'Population, %'
set ytics 1 out nomirror
set mytics 2
set samples (to - from + 1)
set style function impulses
plot [x = from:to] \
Pm(x) lw 2, \
Po(x) lw 2, \
Pe(x) lw 2
|
| Fecha | |
| Fuente | Trabajo propio |
| Autor | Alessio Damato, Mikhail Ryazanov |
- ↑ Kaufman, A.S. (2009) IQ Testing 101, New York (NY): Springer Publishing, pp. 104−109 ISBN: 978-0-8261-0629-2.
Licencia
Yo, titular de los derechos de autor de esta obra, la publico en los términos de las siguientes licencias:

|
Se autoriza la copia, distribución y modificación de este documento bajo los términos de la licencia de documentación libre GNU, versión 1.2 o cualquier otra que posteriormente publique la Fundación para el Software Libre; sin secciones invariables, textos de portada, ni textos de contraportada. Se incluye una copia de la dicha licencia en la sección titulada Licencia de Documentación Libre GNU. |
| Este archivo se encuentra bajo la licencia Creative Commons Genérica de Atribución/Compartir-Igual 3.0. | ||
| ||
| Esta etiqueta de licencia fue agregada a este archivo como parte de la actualización de la licencia GFDL. |
Este archivo se encuentra bajo la licencia Creative Commons de Atribución/Compartir-Igual 2.5 Genérica, 2.0 Genérica y 1.0 Genérica.
- Eres libre:
- de compartir – de copiar, distribuir y transmitir el trabajo
- de remezclar – de adaptar el trabajo
- Bajo las siguientes condiciones:
- atribución – Debes otorgar el crédito correspondiente, proporcionar un enlace a la licencia e indicar si realizaste algún cambio. Puedes hacerlo de cualquier manera razonable pero no de manera que sugiera que el licenciante te respalda a ti o al uso que hagas del trabajo.
- compartir igual – En caso de mezclar, transformar o modificar este trabajo, deberás distribuir el trabajo resultante bajo la misma licencia o una compatible como el original.
Puedes usar la licencia que prefieras.
Historial del archivo
Haz clic sobre una fecha y hora para ver el archivo tal como apareció en ese momento.
| Fecha y hora | Miniatura | Dimensiones | Usuario | Comentario | |
|---|---|---|---|---|---|
| actual | 23:11 26 nov 2020 | | 600 × 480 (9 kB) | Paranaja | Reverted to version as of 21:27, 2 November 2012 (UTC) |
| 21:27 2 nov 2012 |  | 600 × 480 (9 kB) | Mikhail Ryazanov | IQ values are now integers; gnuplot-only approach | |
| 09:20 6 dic 2006 |  | 600 × 480 (12 kB) | Alejo2083 | {{Information |Description= The IQ test is made so that most of the people will score 100 and the distribution will have the shape of a Gaussian function, with a standard deviation of 15. The plot shows the percentage of people getting a score versus the |
Usos del archivo
Las siguientes páginas usan este archivo:
Uso global del archivo
Las wikis siguientes utilizan este archivo:
- Uso en ar.wikipedia.org
- Uso en ast.wikipedia.org
- Uso en az.wikipedia.org
- Uso en ba.wikipedia.org
- Uso en be-tarask.wikipedia.org
- Uso en be.wikipedia.org
- Uso en ca.wikipedia.org
- Uso en cs.wikipedia.org
- Uso en da.wikipedia.org
- Uso en de.wikipedia.org
- Intelligenzquotient
- Normwert
- Wikipedia:WikiProjekt Psychologie/Archiv
- Benutzer:SonniWP/Hochbegabung
- Kritik am Intelligenzbegriff
- The Bell Curve
- Benutzer:Rainbowfish/Bilder
- Quantitative Psychologie
- Intelligenzprofil
- Benutzer:LauM Architektur/Babel
- Benutzer:LauM Architektur/Babel/Überdurchschnittlicher IQ
- Uso en de.wikibooks.org
- Elementarwissen medizinische Psychologie und medizinische Soziologie: Theoretisch-psychologische Grundlagen
- Elementarwissen medizinische Psychologie und medizinische Soziologie/ Druckversion
- Elementarwissen medizinische Psychologie und medizinische Soziologie/ Test
- Benutzer:OnkelDagobert:Wikilinks:Psychologie
- Uso en de.wikiversity.org
- Uso en en.wikipedia.org
- User:Michael Hardy
- User:Robinh
- User:Itsnotvalid
- User:M.e
- User:Quandaryus
- User:Astronouth7303
- User:Mattman723
- User:Iothiania
- User:Octalc0de
- Portal:Mathematics/Featured picture archive
- User:Dirknachbar
- User talk:BlaiseFEgan
- User:Albatross2147
- User:Klortho
- User:Kvasir
- User:Spellcheck
- User:Heptadecagram
- User:Patrick1982
- User:NeonMerlin/boxes
- User:Cswrye
Ver más uso global de este archivo.