
Archivo:Global Temperature Anomaly-es.svg

Tamaño de esta previsualización PNG del archivo SVG: 708 × 599 píxeles. Otras resoluciones: 284 × 240 píxeles · 567 × 480 píxeles · 907 × 768 píxeles · 1210 × 1024 píxeles · 2420 × 2048 píxeles · 951 × 805 píxeles.
Ver la imagen en su resolución original ((Imagen SVG, nominalmente 951 × 805 pixels, tamaño de archivo: 32 kB))
Resumen
| Descripción |
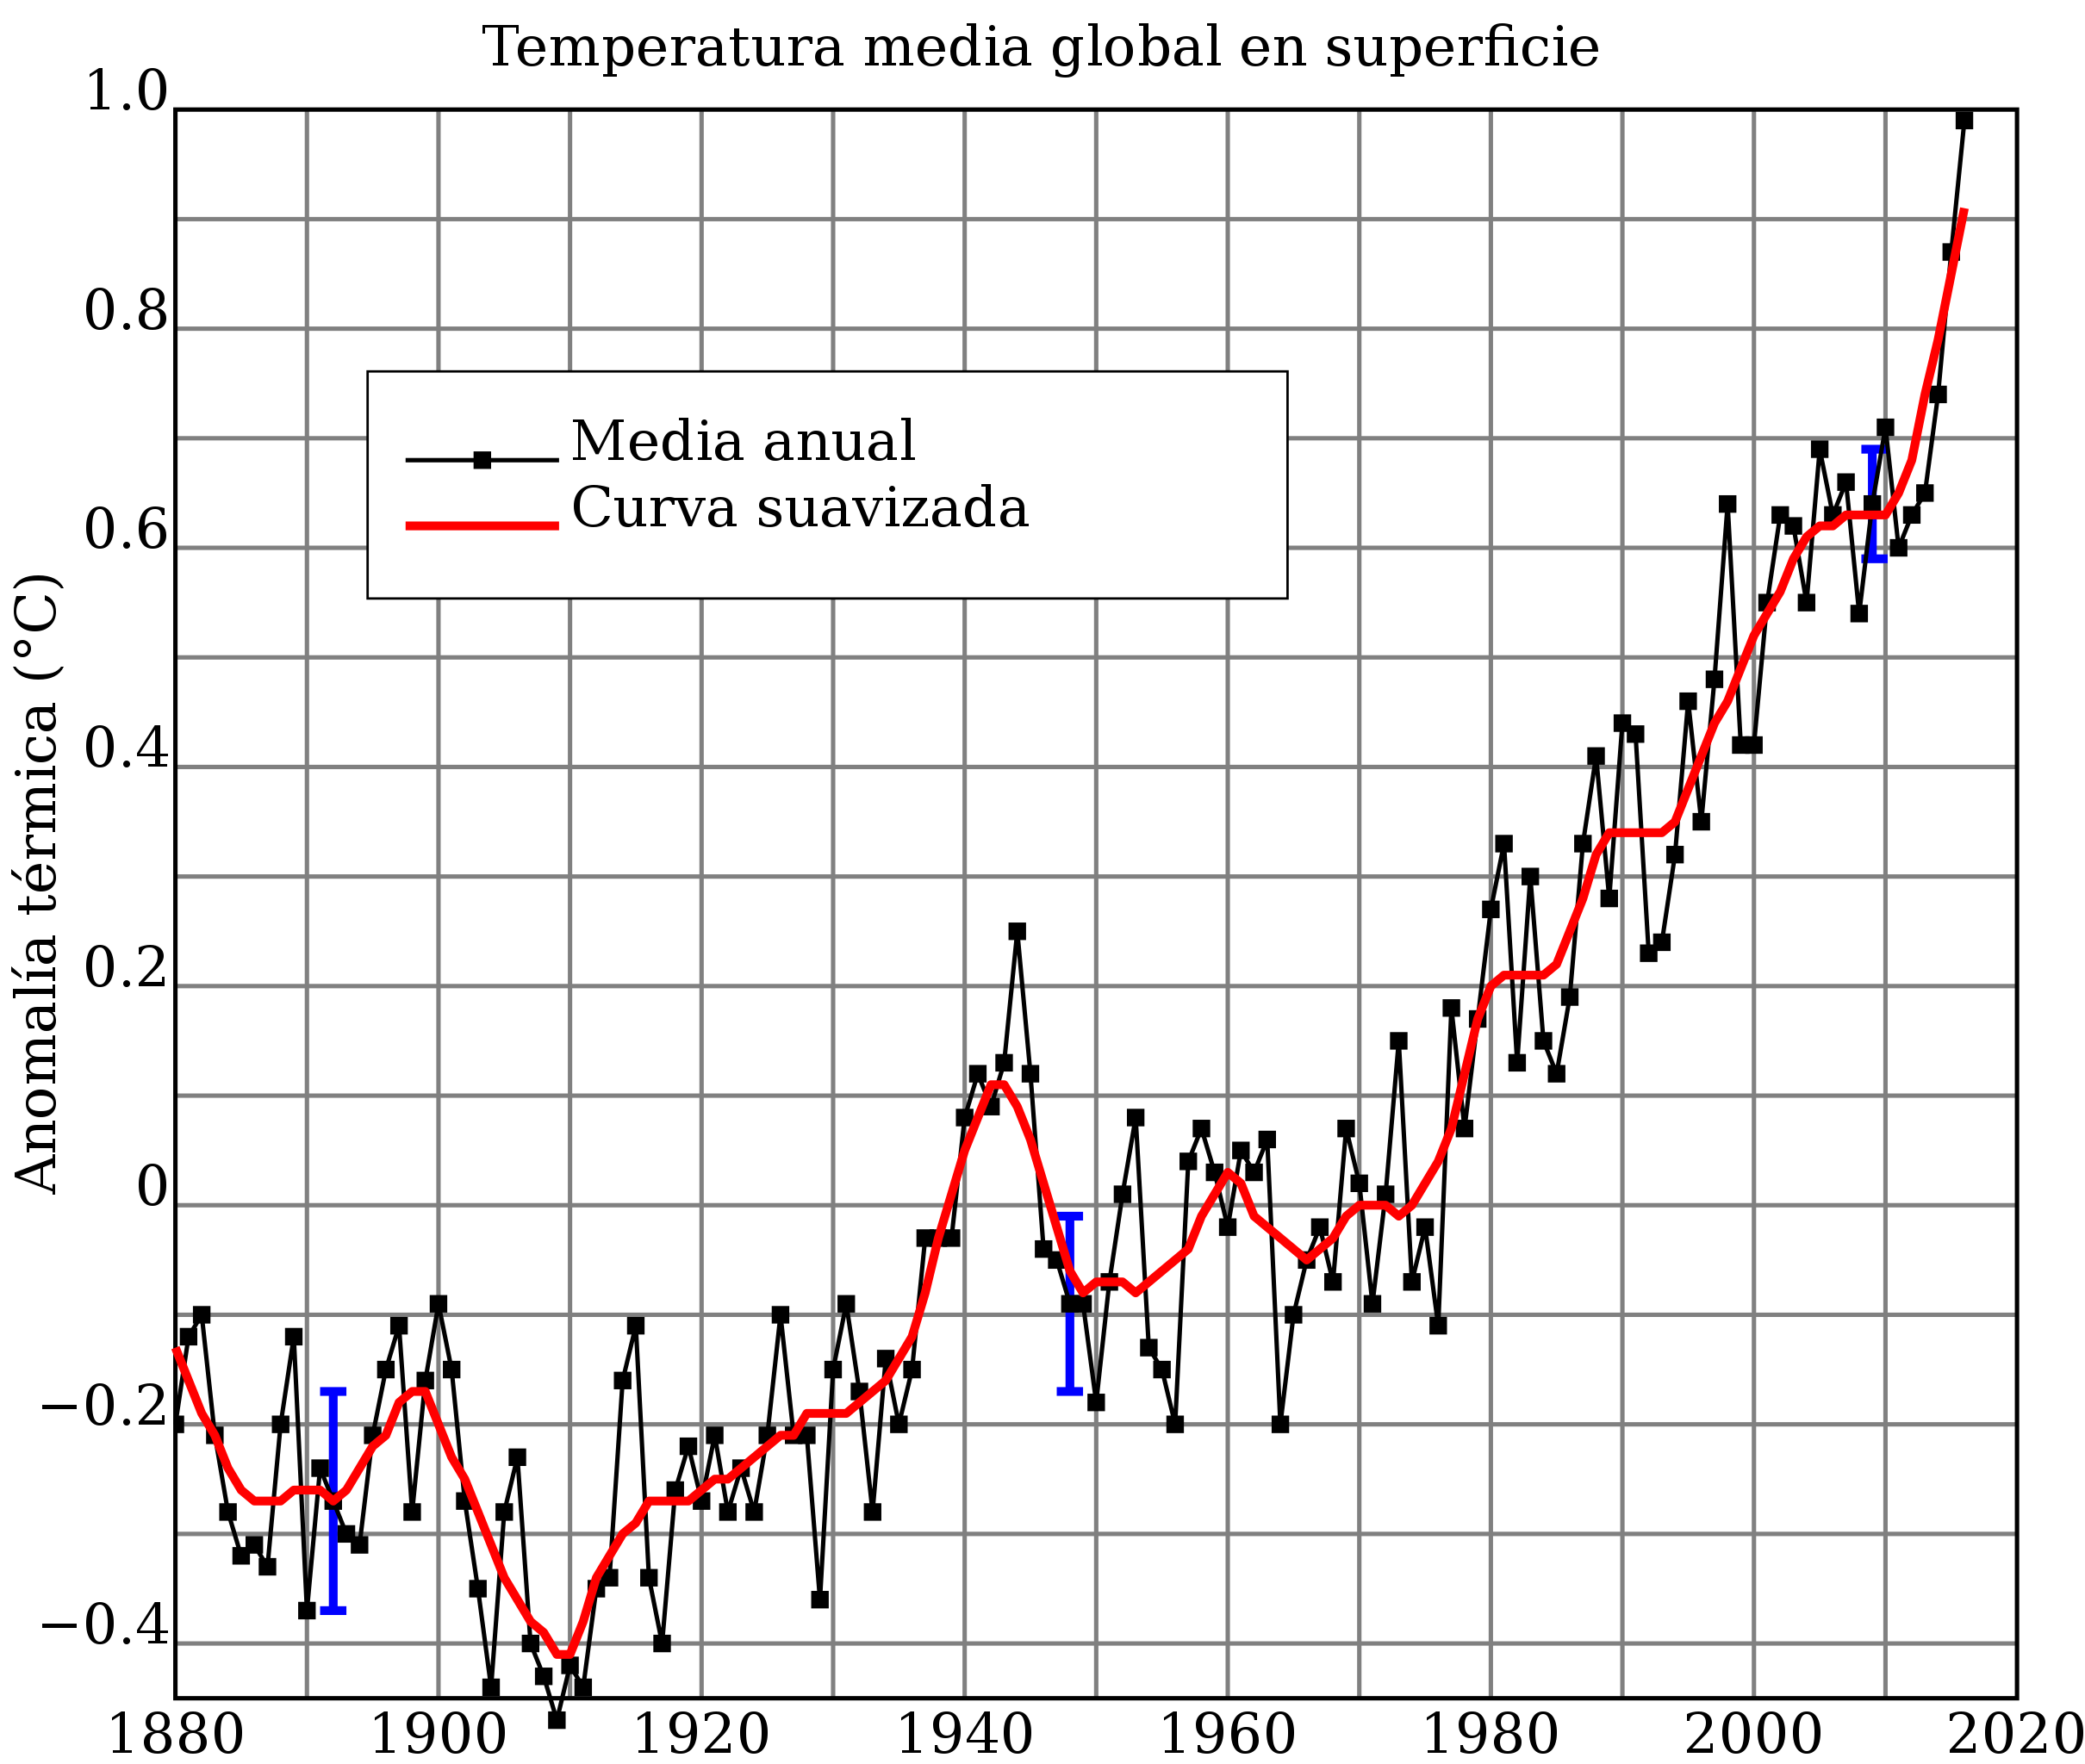
English: Line plot of global mean land-ocean temperature index, 1880 to present (2013), with the base period 1951-1980. Version in Spanish of the graph already in commons . Español: Índice de la temperatura media global, desde 1880 hasta la actualidad, con el período base 1951-1980. La línea negra sólida es la media global anual y la línea roja sólida es una curva suavizada con una regresión local no paramétrica basada en un modelo k vecino más cercano. La función se evalúa utilizando una parte de los datos correspondiente a un rango de diez años de datos, lo que resulta en un suavizado en la práctica de aproximadamente cinco años. Las barras azules representan la incertidumbre (límite de confianza del 95%) para el caso de observaciones espaciales incompletas. Esto se basa en la Fig. 1A en Hansen et al. (2006) y la Fig. 9a en Hansen et al. (2010). Gráfico actualizado con datos hasta 2016 procedentes de https://data.giss.nasa.gov/gistemp/graphs/. El gráfico muestra una tendencia global de calentamiento a largo plazo. |
| Fecha | |
| Fuente |
adaptation in Spanish on the basis of  |
| Autor | Basquetteur |
| Otras versiones |
|
Licencia
Yo, el titular de los derechos de autor de esta obra, la publico en los términos de la siguiente licencia:
Este archivo está disponible bajo la licencia Creative Commons Atribución-CompartirIgual 4.0 Internacional.
- Eres libre:
- de compartir – de copiar, distribuir y transmitir el trabajo
- de remezclar – de adaptar el trabajo
- Bajo las siguientes condiciones:
- atribución – Debes otorgar el crédito correspondiente, proporcionar un enlace a la licencia e indicar si realizaste algún cambio. Puedes hacerlo de cualquier manera razonable pero no de manera que sugiera que el licenciante te respalda a ti o al uso que hagas del trabajo.
- compartir igual – En caso de mezclar, transformar o modificar este trabajo, deberás distribuir el trabajo resultante bajo la misma licencia o una compatible como el original.
Historial del archivo
Haz clic sobre una fecha y hora para ver el archivo tal como apareció en ese momento.
| Fecha y hora | Miniatura | Dimensiones | Usuario | Comentario | |
|---|---|---|---|---|---|
| actual | 06:14 7 mar 2017 | | 951 × 805 (32 kB) | Basquetteur | corrected mistake in terminology for curve in red |
| 17:20 18 feb 2017 |  | 951 × 805 (32 kB) | Basquetteur | box with legend inside graph did not render properly and text overflew over box | |
| 17:17 18 feb 2017 |  | 951 × 805 (31 kB) | Basquetteur | Updated with new more recent data from the original graph in English. Mofified translations of headings in Spanish also adapted, according to the IPCC Fifth Assessment Report in Spanish terminology | |
| 09:31 31 ene 2016 |  | 951 × 755 (30 kB) | Basquetteur | box of legend inside graphic does not seem to render properly | |
| 09:28 31 ene 2016 |  | 951 × 755 (30 kB) | Basquetteur | Update data and correct translation as requested by Hiperfelix | |
| 03:13 17 jun 2015 |  | 910 × 655 (66 kB) | Jarould | fix caption | |
| 03:09 17 jun 2015 |  | 910 × 655 (66 kB) | Jarould | fix superimposed subtitles | |
| 03:06 17 jun 2015 |  | 910 × 655 (71 kB) | Jarould | Updating | |
| 20:28 25 dic 2014 |  | 910 × 655 (49 kB) | Basquetteur | text to path to put object in proper place | |
| 20:17 25 dic 2014 |  | 910 × 655 (23 kB) | Basquetteur | User created page with UploadWizard |
Usos del archivo
Las siguientes páginas usan este archivo:
Uso global del archivo
Las wikis siguientes utilizan este archivo:
- Uso en ast.wikipedia.org
- Uso en sc.wikipedia.org