
Archivo:U.S. GDP - Real vs. Potential Per CBO Forecasts of 2007 and 2016.png
Tamaño de esta previsualización: 800 × 365 píxeles. Otras resoluciones: 320 × 146 píxeles · 1005 × 459 píxeles.
Ver la imagen en su resolución original (1005 × 459 píxeles; tamaño de archivo: 21 kB; tipo MIME: image/png)
Understanding the chart
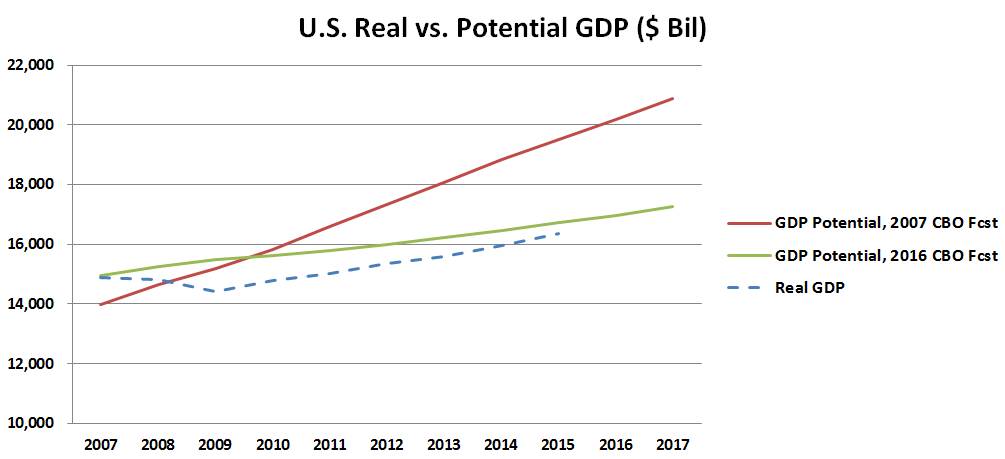
The chart compares two CBO projections of real potential GDP (the GDP amount the economy could theoretically produce at full employment) with actual real GDP. It shows how the Great Recession of 2007-2009 has impacted the trajectory. It is an updated version of a chart first presented by economist Lawrence Summers in February 2014 [1] and was more recently updated in a New York Times article by Neil Irwin in August, 2016.[2]
Resumen
| Descripción |
English: This chart compares U.S. potential GDP under two CBO forecasts (one from 2007 and one from 2016) versus the actual real GDP. It is based on a similar diagram from economist Larry Summers from 2014. |
| Fecha | |
| Fuente | Trabajo propio |
| Autor | Farcaster |
References
Licencia
Yo, el titular de los derechos de autor de esta obra, la publico en los términos de la siguiente licencia:
Este archivo está disponible bajo la licencia Creative Commons Attribution-Share Alike 4.0 International.
- Eres libre:
- de compartir – de copiar, distribuir y transmitir el trabajo
- de remezclar – de adaptar el trabajo
- Bajo las siguientes condiciones:
- atribución – Debes otorgar el crédito correspondiente, proporcionar un enlace a la licencia e indicar si realizaste algún cambio. Puedes hacerlo de cualquier manera razonable pero no de manera que sugiera que el licenciante te respalda a ti o al uso que hagas del trabajo.
- compartir igual – En caso de mezclar, transformar o modificar este trabajo, deberás distribuir el trabajo resultante bajo la misma licencia o una compatible como el original.
Historial del archivo
Haz clic sobre una fecha y hora para ver el archivo tal como apareció en ese momento.
| Fecha y hora | Miniatura | Dimensiones | Usuario | Comentario | |
|---|---|---|---|---|---|
| actual | 02:26 21 jul 2016 | | 1005 × 459 (21 kB) | Farcaster | User created page with UploadWizard |
Usos del archivo
La siguiente página usa este archivo:
Uso global del archivo
Las wikis siguientes utilizan este archivo:
- Uso en en.wikipedia.org
- Uso en he.wikipedia.org
- Uso en ja.wikipedia.org
- Uso en ru.wikipedia.org